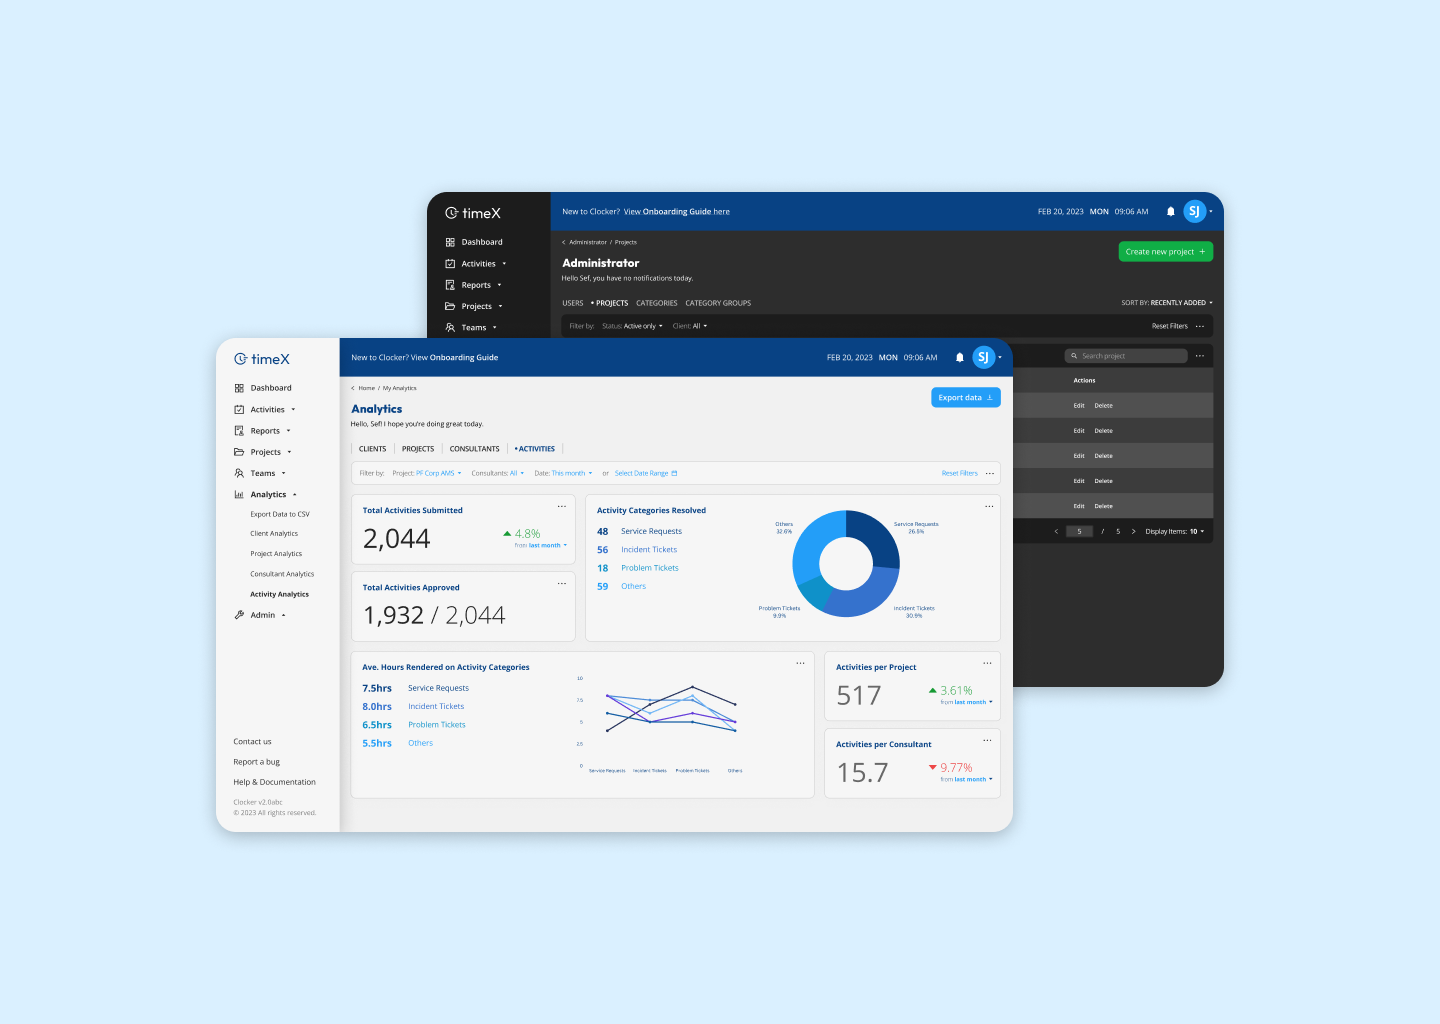
timeX v2.0
Overview
The Problem
bneXt, Inc. faced a challenge: consultants logging activities inconsistently, leading to billing delays and project management inefficiencies. The bi-weekly or monthly logging routine hindered real-time tracking and created gaps in service reports.
The Requested Solution
Efficient daily activity logging was sought to streamline workflows, empowering consultants and project managers/approvers. The goal was to ensure timely, accurate service reports for effective client billing.
The Other Problem
An existing product (timeX v1.0) was already in place and was being developed over nine months running 🤯 but was quite lacking in terms of user experience. As a result, the prolonged development time and suboptimal UX hindered the efficiency of consultants and project managers.
The Goal
To compensate for the extended development time, the suggested solution involved revisiting the problem, analyzing the MVP's effectiveness, and redefining the user experience. The goal was to expedite improvements while maintaining a user-centric approach.
Research & Analysis
Usability Testing
Before usability testing, the initial System Usability Scale (SUS) was at 75.31, with a Customer Satisfaction Score (CSAT) of 3.88/5, and a Net Promoter Score (NPS) of -25. The survey set the baseline for user satisfaction.
Following usability testing and interviews, there was a notable improvement. The SUS increased to 76.54, and CSAT scores for submitting activities and creating service reports rose to 4.25/5 and 4.33/5, respectively. The combined CSAT reached an encouraging 4.29/5, and the NPS improved to 31.
Task Metrics
While the average time on task for the survey was 90 seconds, the observational average dropped to 62.75 seconds. Importantly, the average task success rate achieved an impressive 100%.
Key Takeaways
- Presentation of Data: Users expressed concerns about data presentation, indicating a need for clearer and more user-friendly ways of displaying information.
- User Interface + User Experience: Although improvements were made, feedback highlighted that there's still room to enhance the overall user interface and experience, emphasizing a need for simplicity and intuitiveness.
- Heuristic Functions are Lacking: Users indicated that some essential heuristic functions were lacking, pointing to the need for the incorporation of key features to enhance usability.
- Time on Task Takes a While: Despite improvements, there's a consensus that further optimization is required to reduce the time on task, emphasizing the importance of efficiency in user interactions.
While the results are promising, these insights underscore the iterative nature of usability improvements. The feedback provides a clear roadmap for refining the application, focusing on data presentation, UI/UX enhancements, inclusion of heuristic functions, and further reduction of time on task to ensure a seamless and efficient user experience.

Heuristic Evaluation
After usability testing and interviews, a heuristic evaluation was conducted on distinct user journeys. Scores revealed specific areas for improvement:
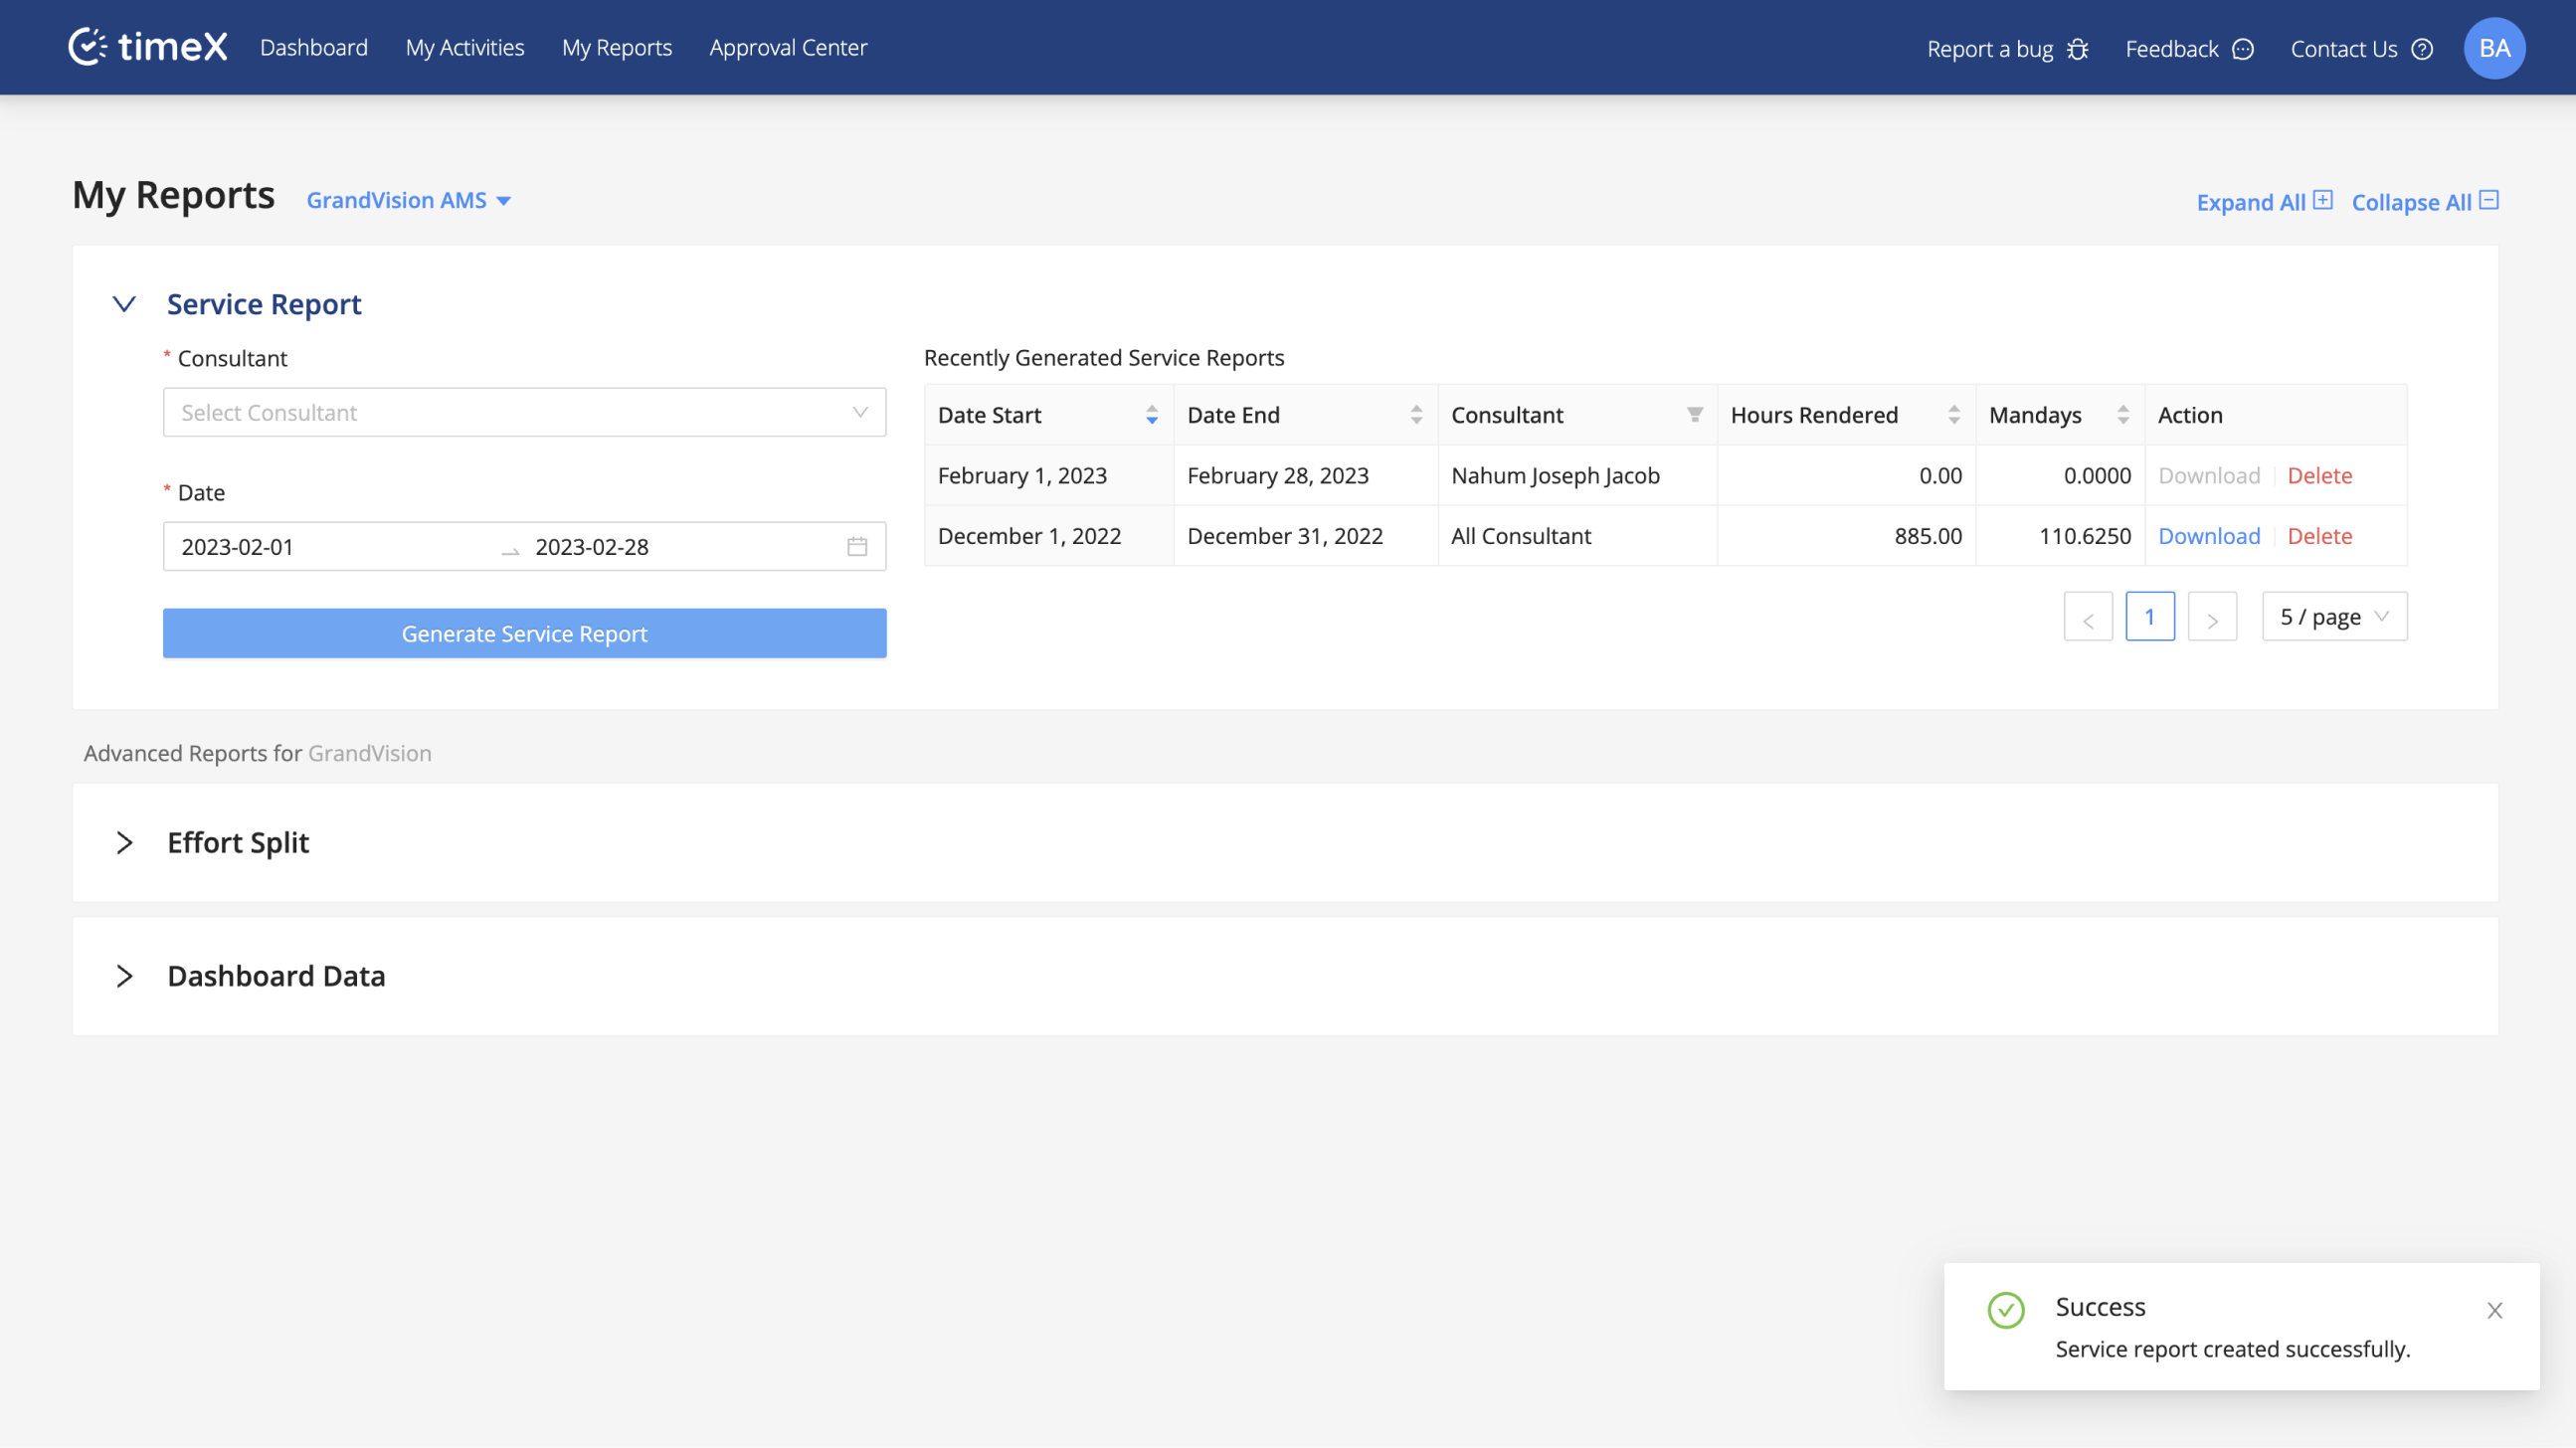
Adding/Editing/Copying/Deleting Activities = 54.5/100:
Creating/Downloading/Deleting Service Reports = 72.7/100:
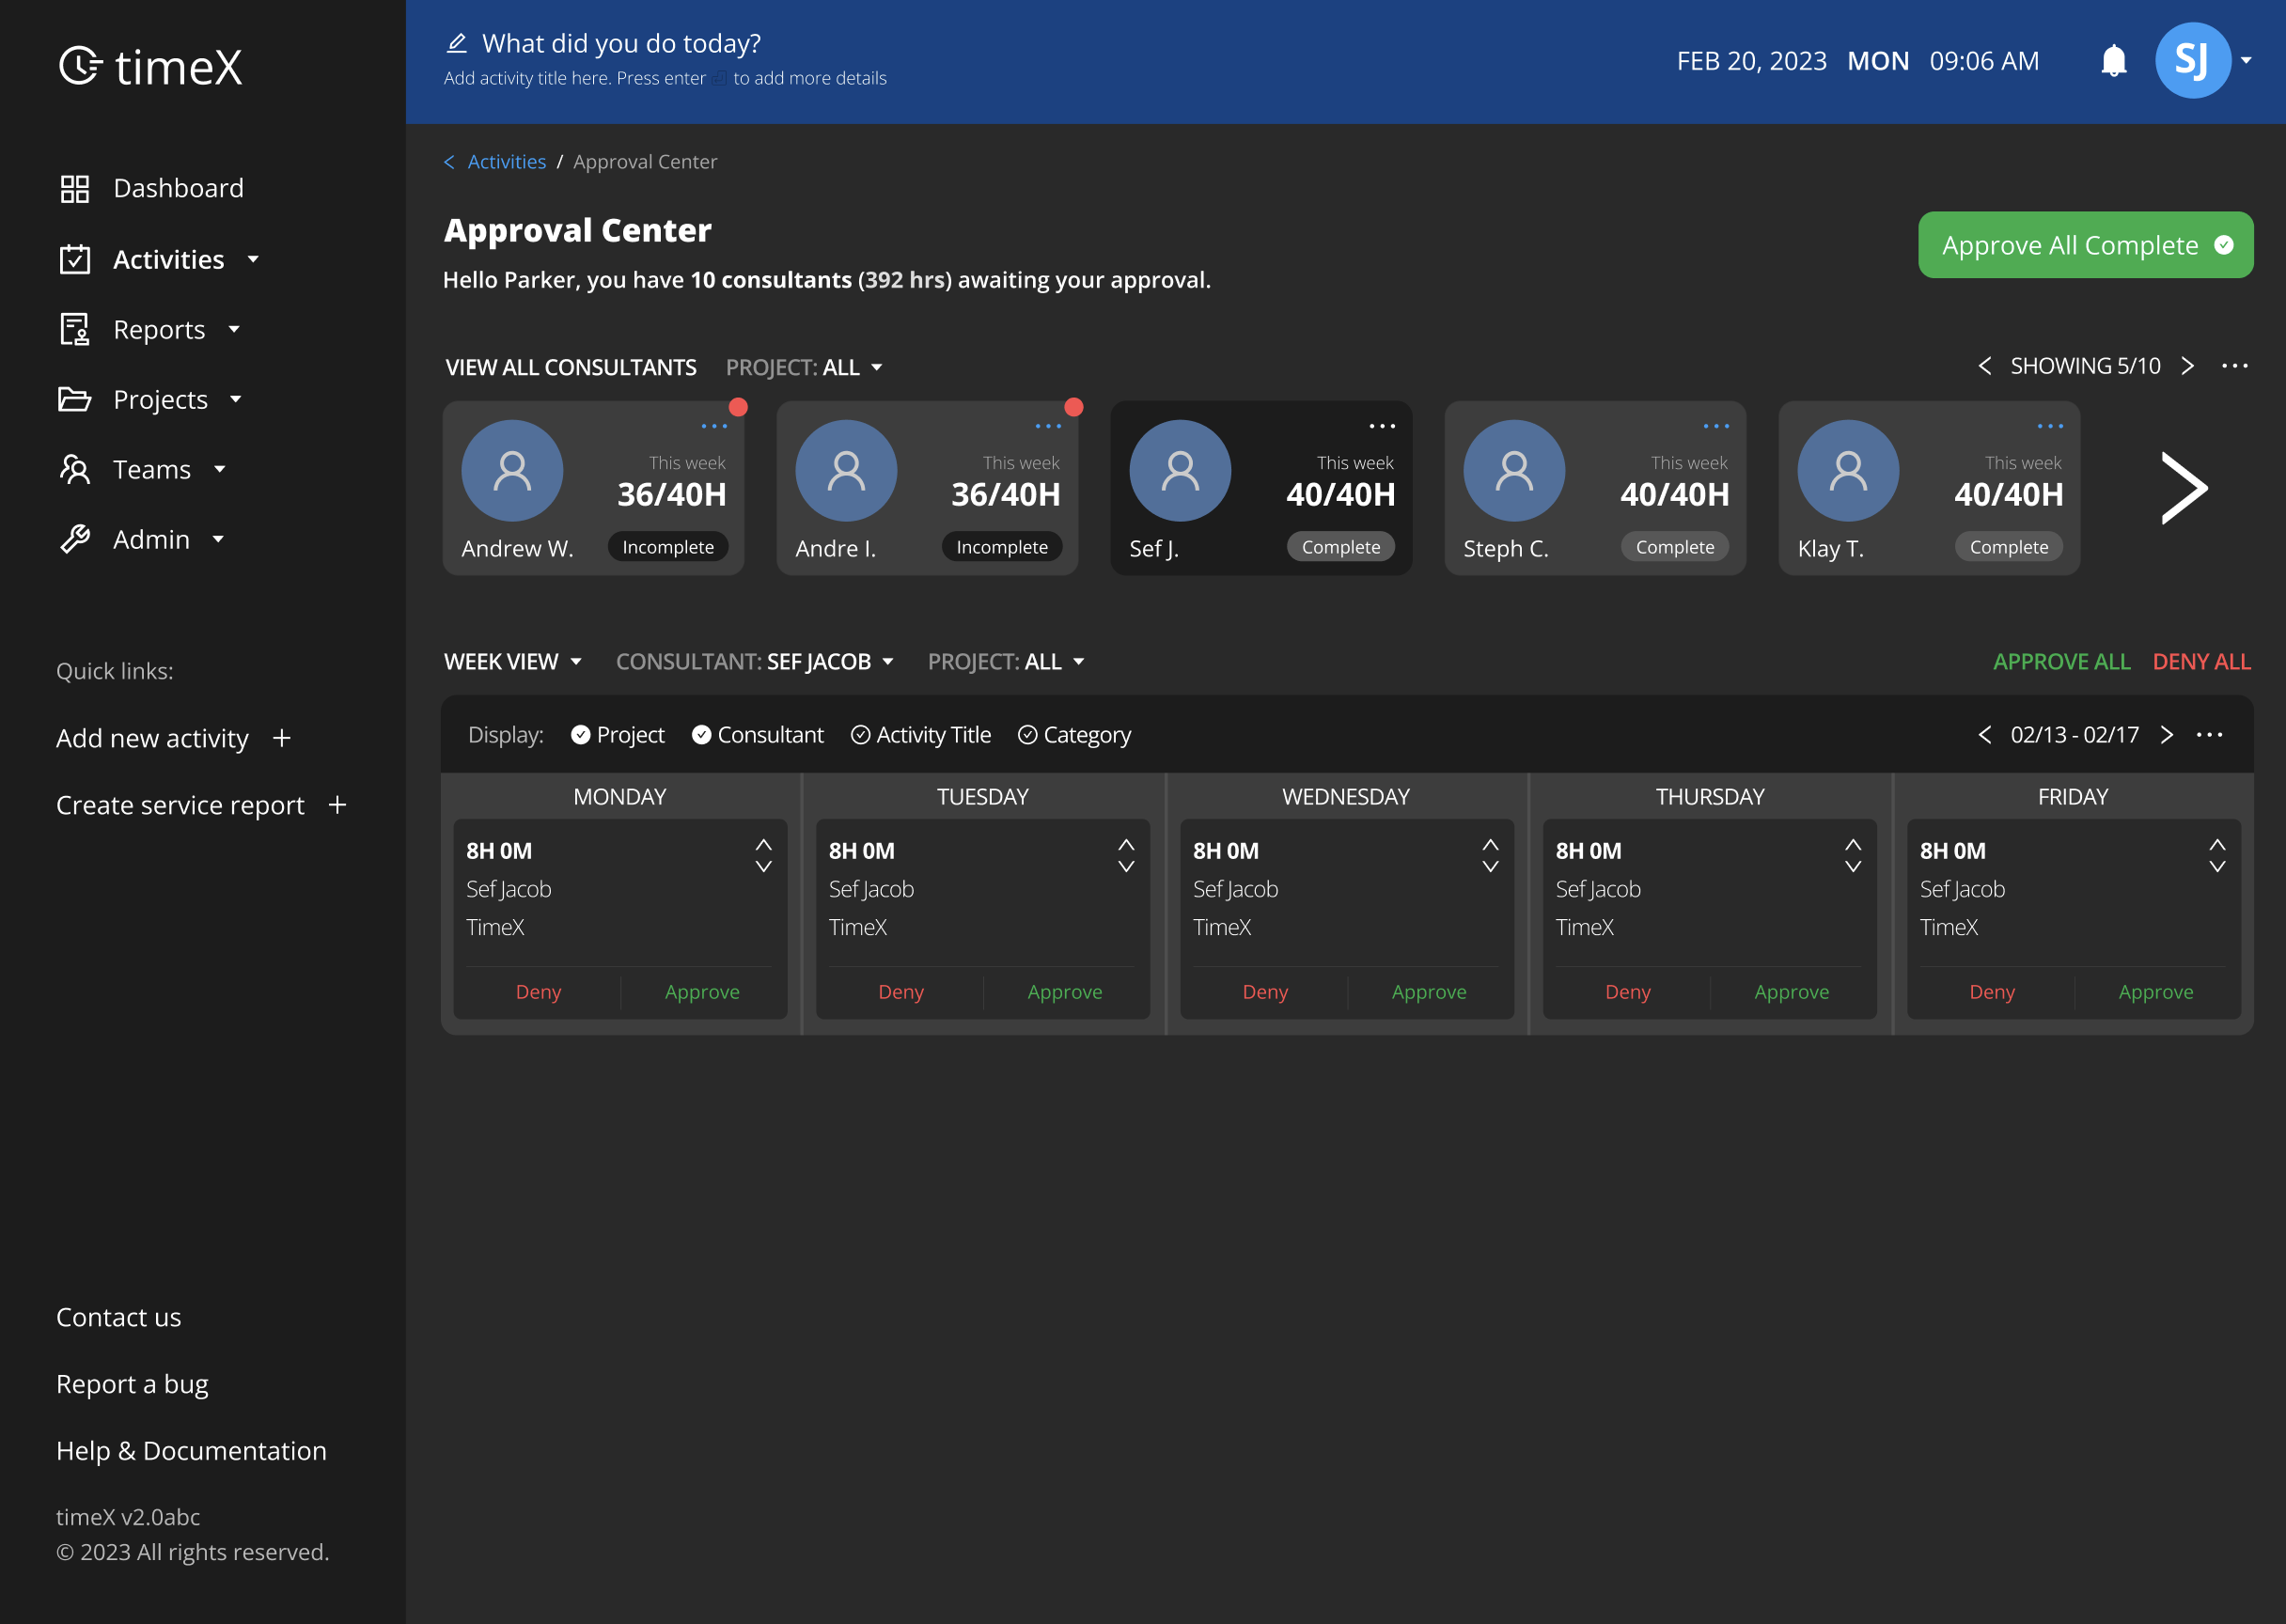
Approving/Denying Activities = 59.1/100

Competitor Analysis
In our thorough competitor analysis, we scrutinized various applications designed for activity logging, with a particular focus on Odoo Timesheets. This examination provided valuable insights into the strengths, weaknesses, and notable features of Odoo Timesheets in comparison to other solutions in the market.

Ideation & Optimization
Improving Navigation
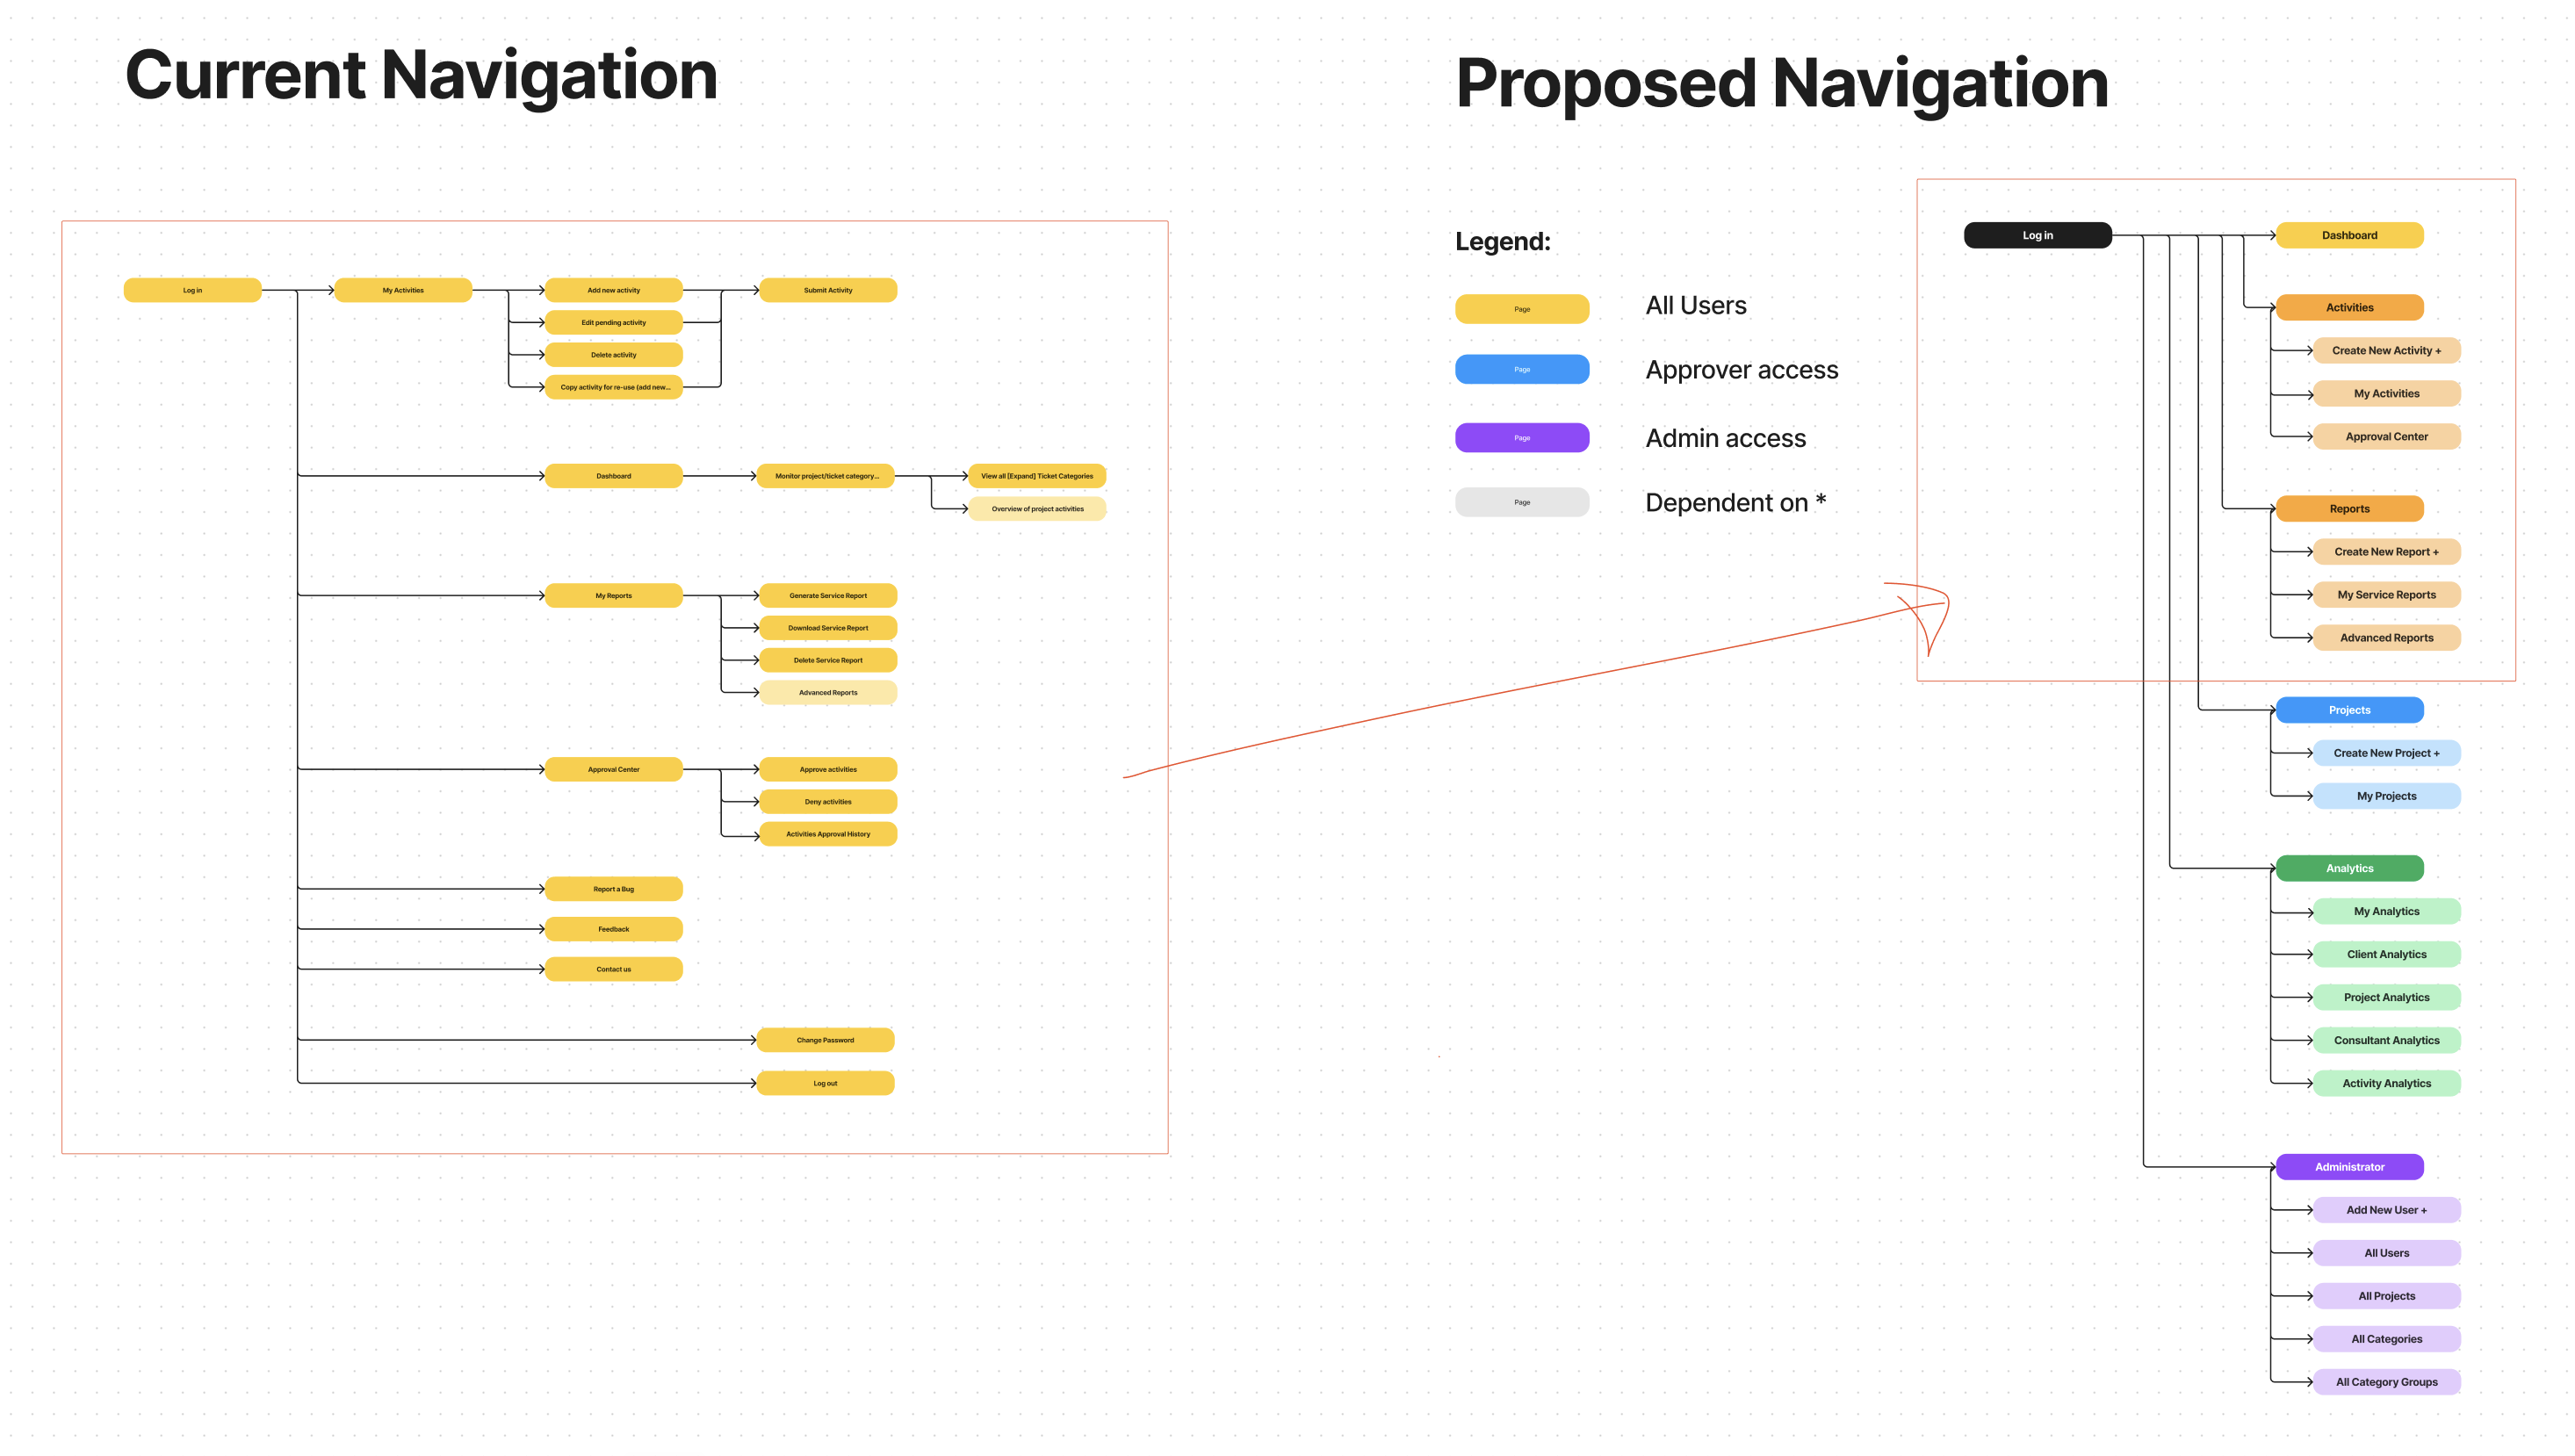
Initial User Flows
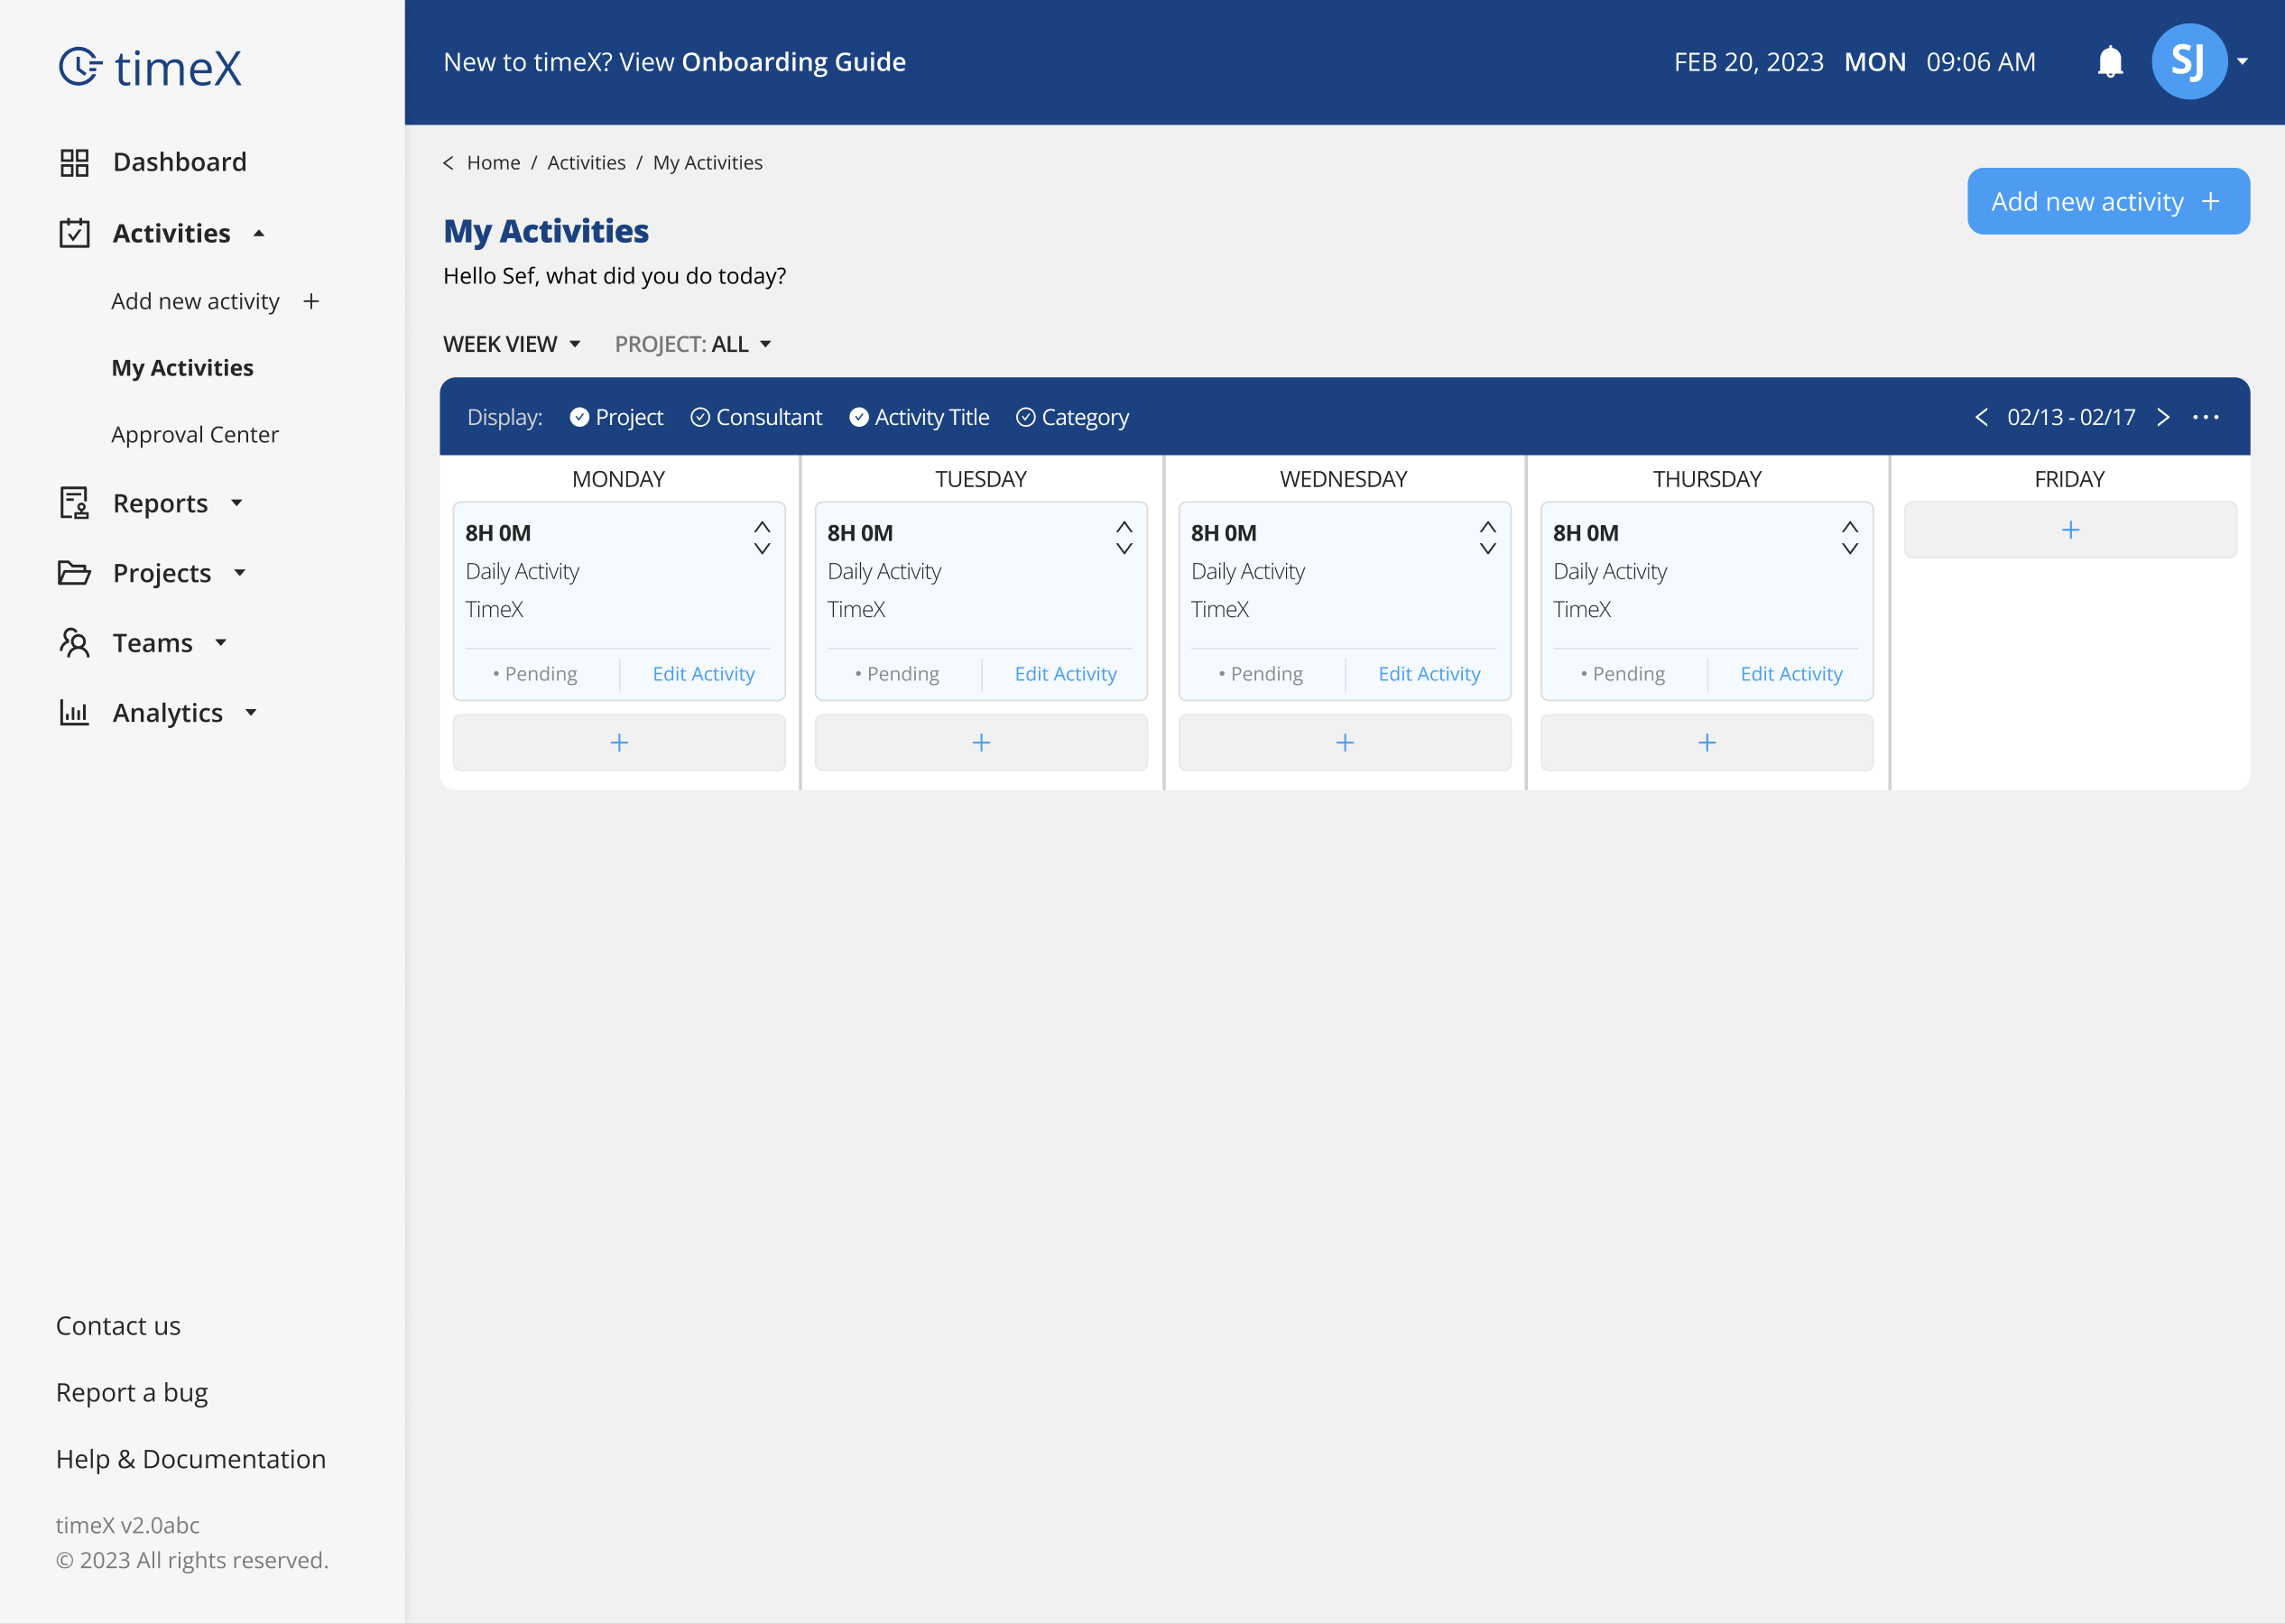
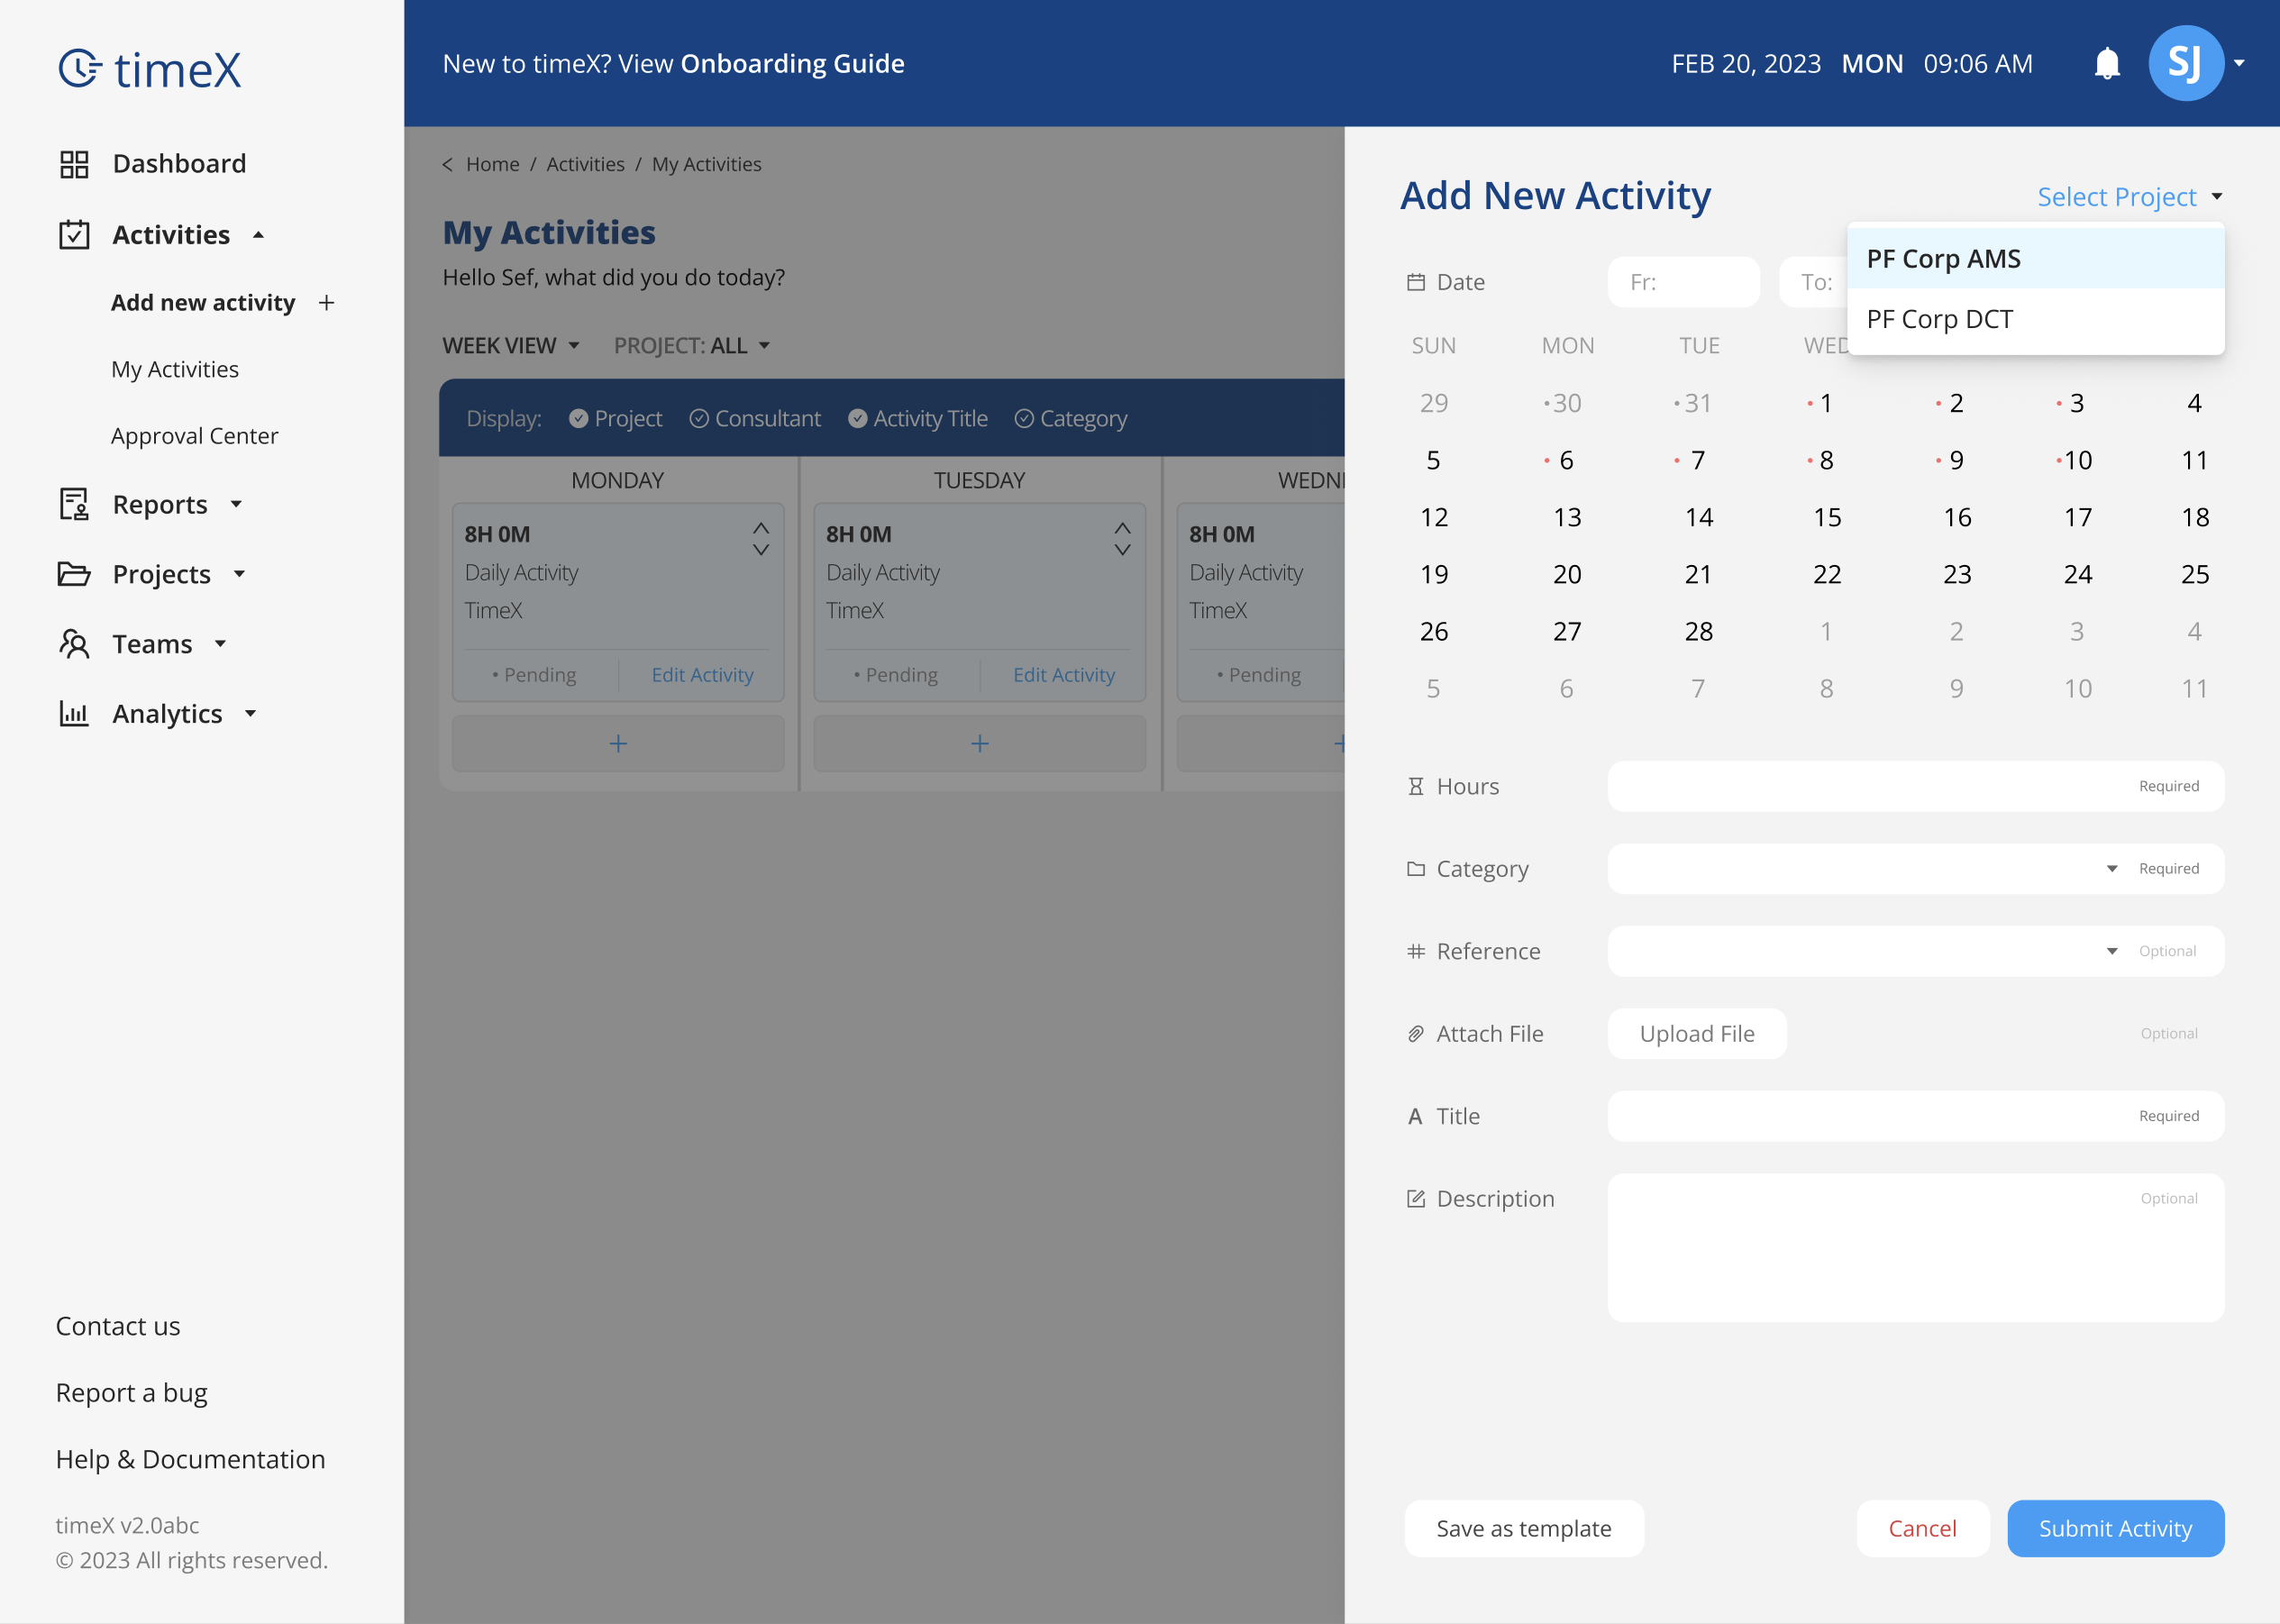
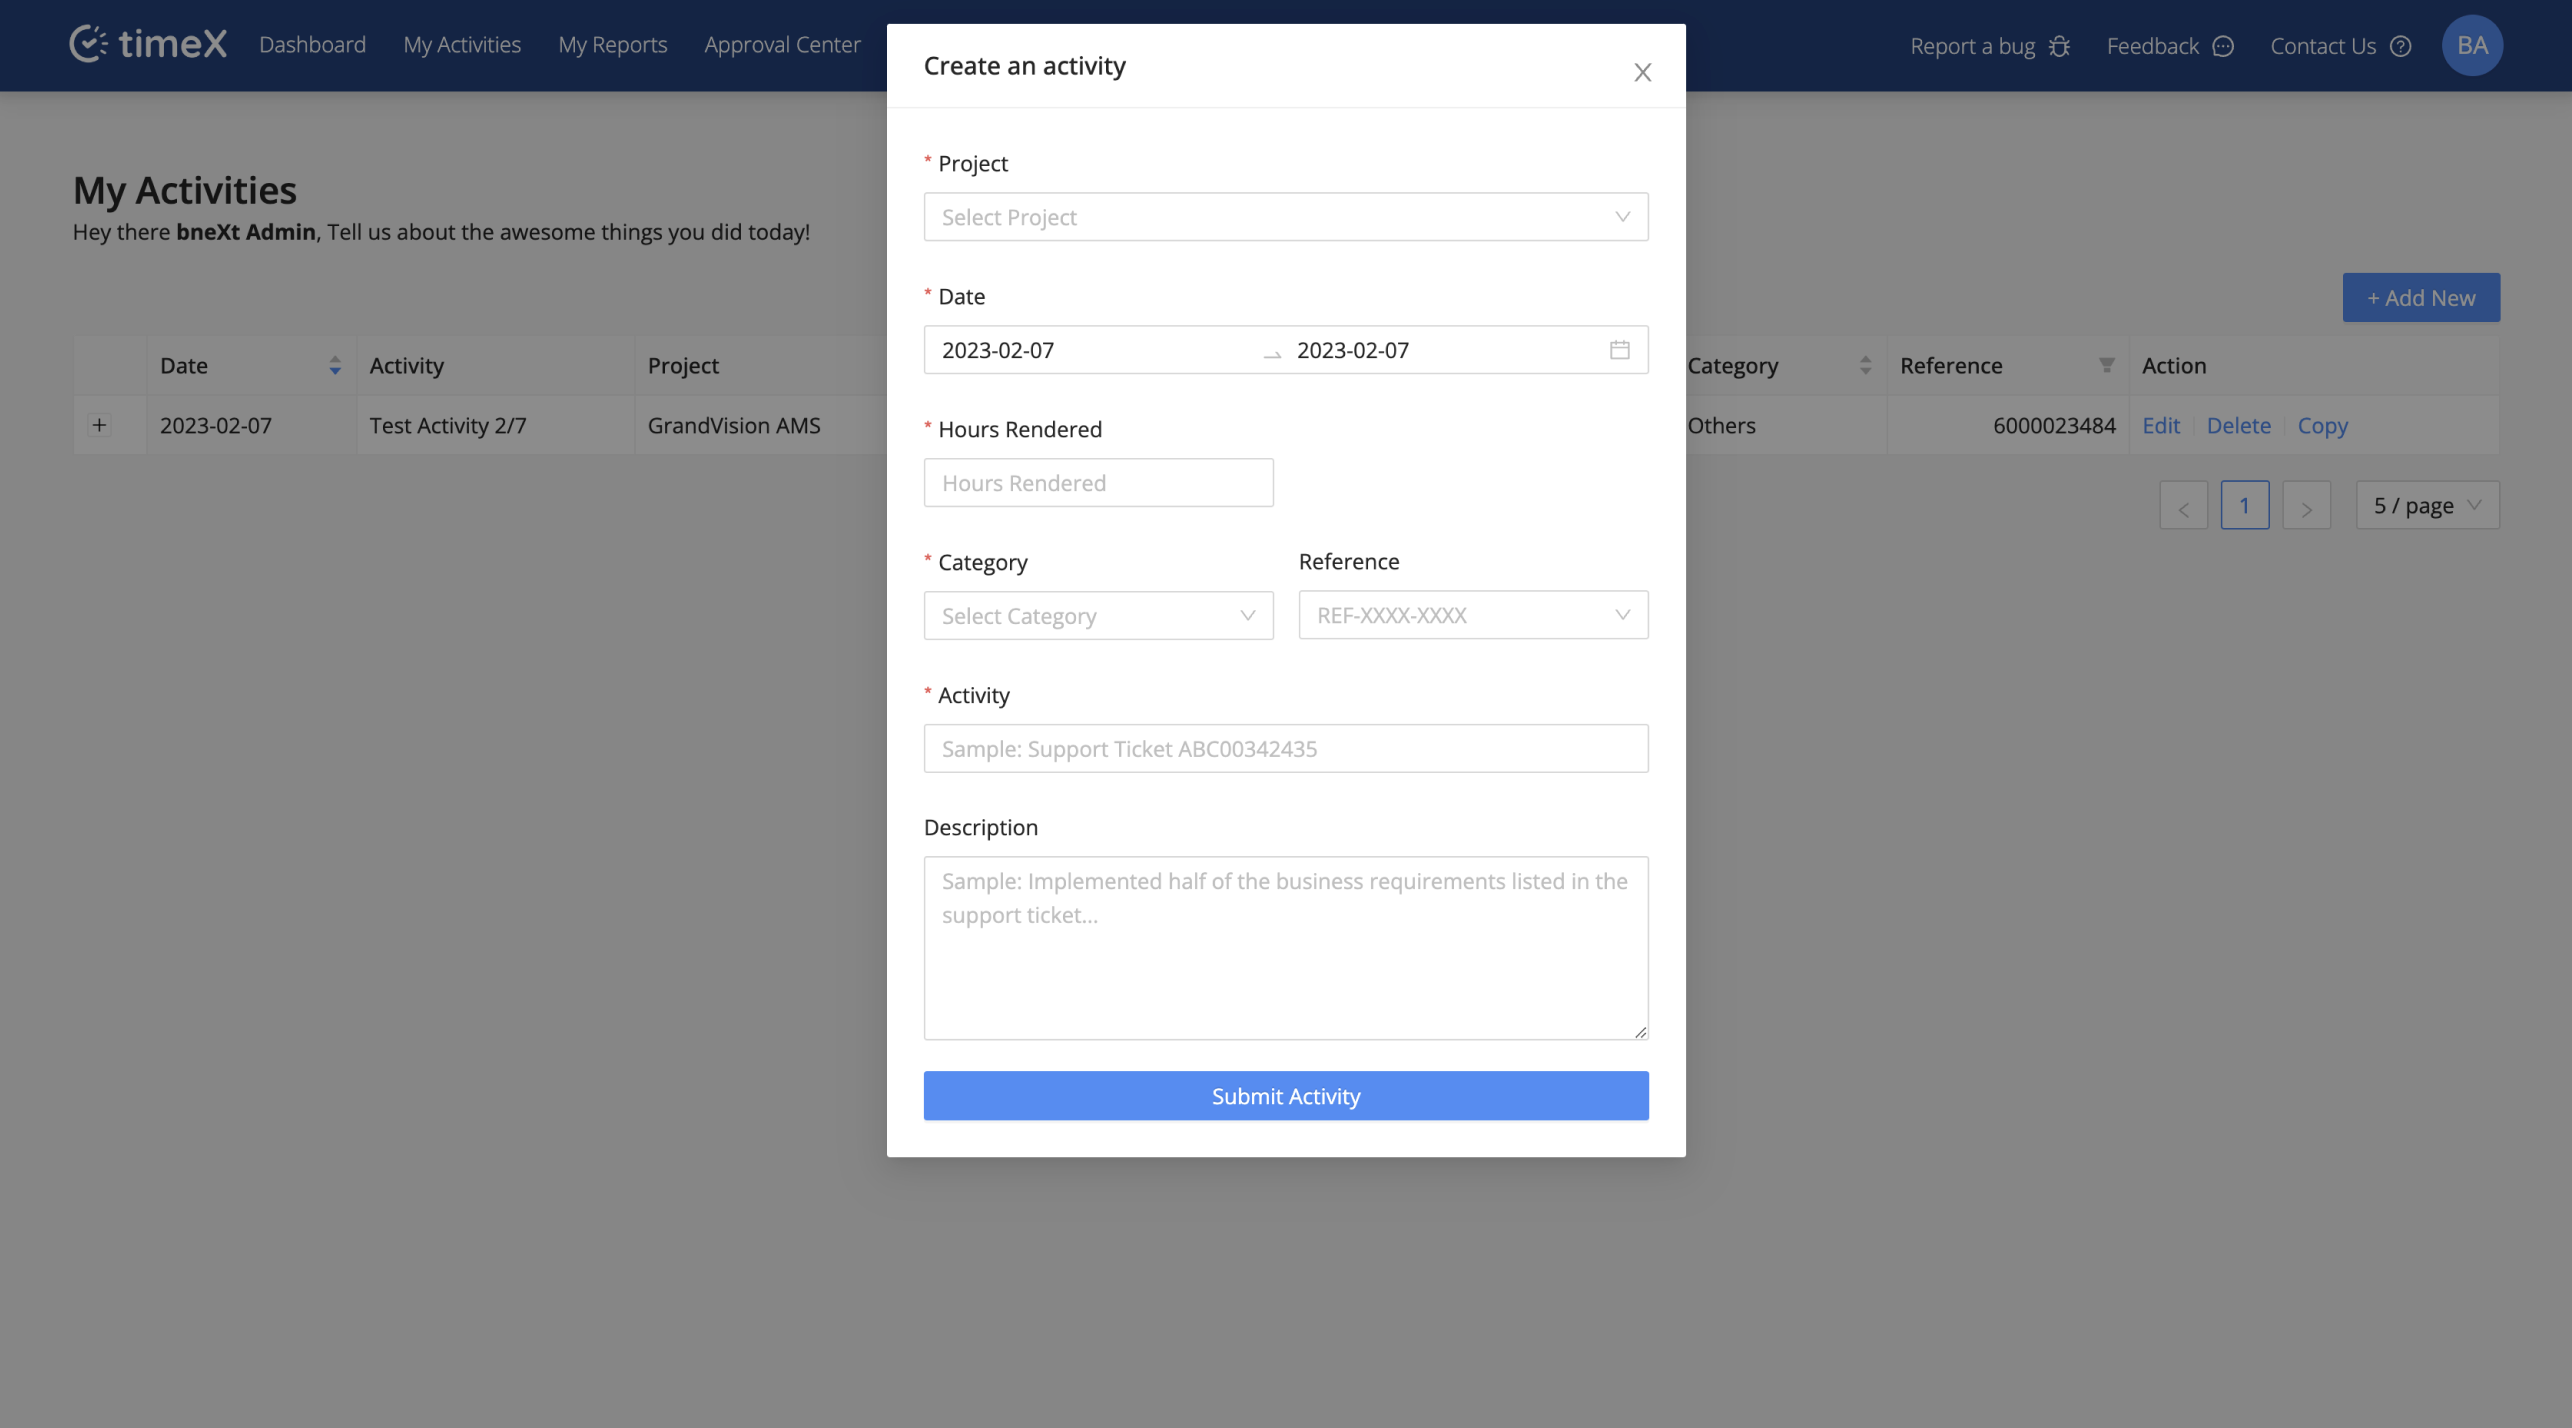
After reviewing how users submit activities in the application, it's clear that although it has a perfect success rate, the process is not efficient. Users have to go through 11 steps to submit an activity. I want to show stakeholders that the complexity of this process is affecting user experience.
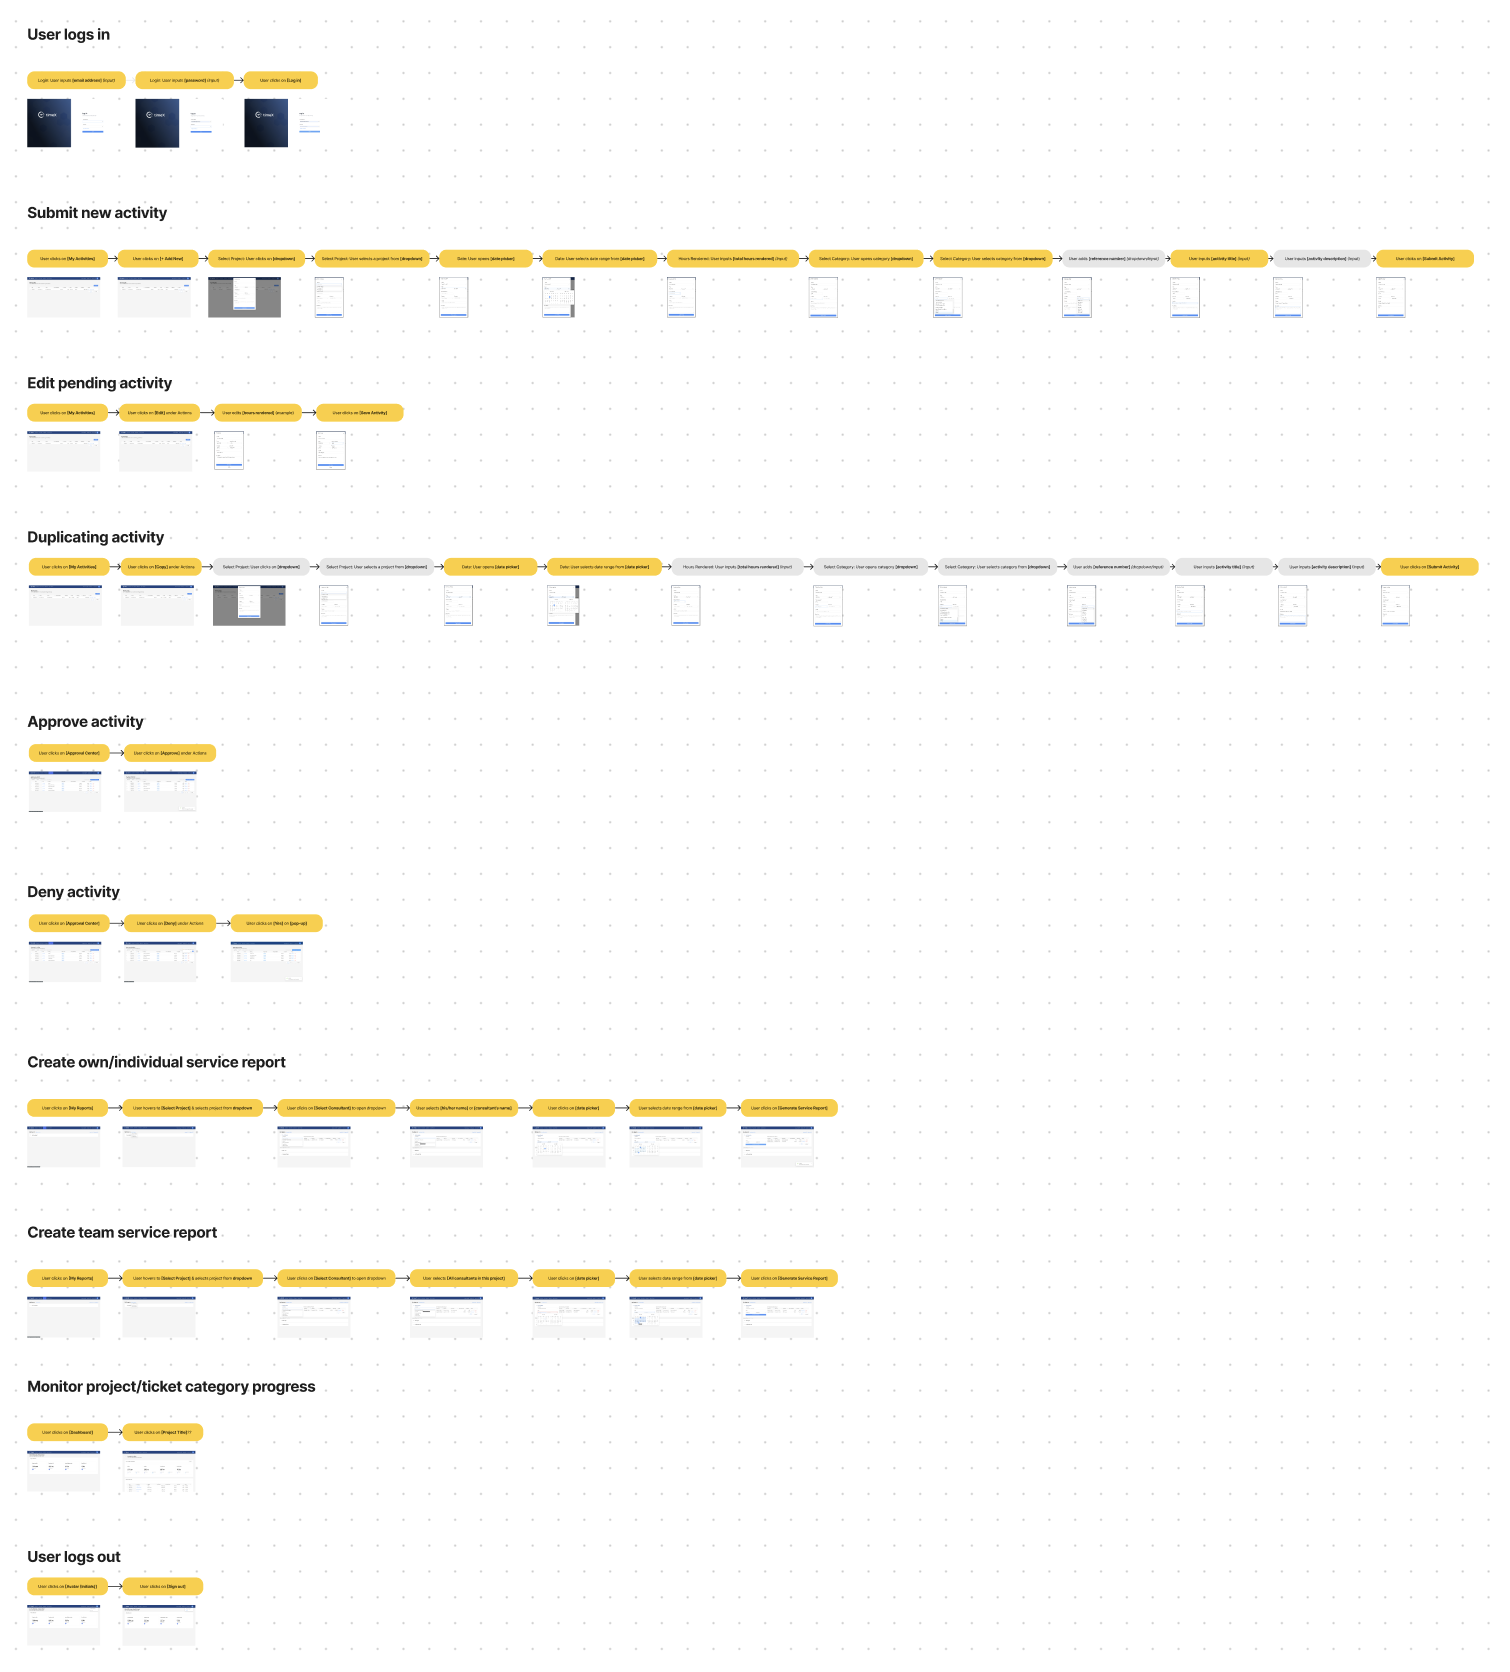
Optimizing User Flows

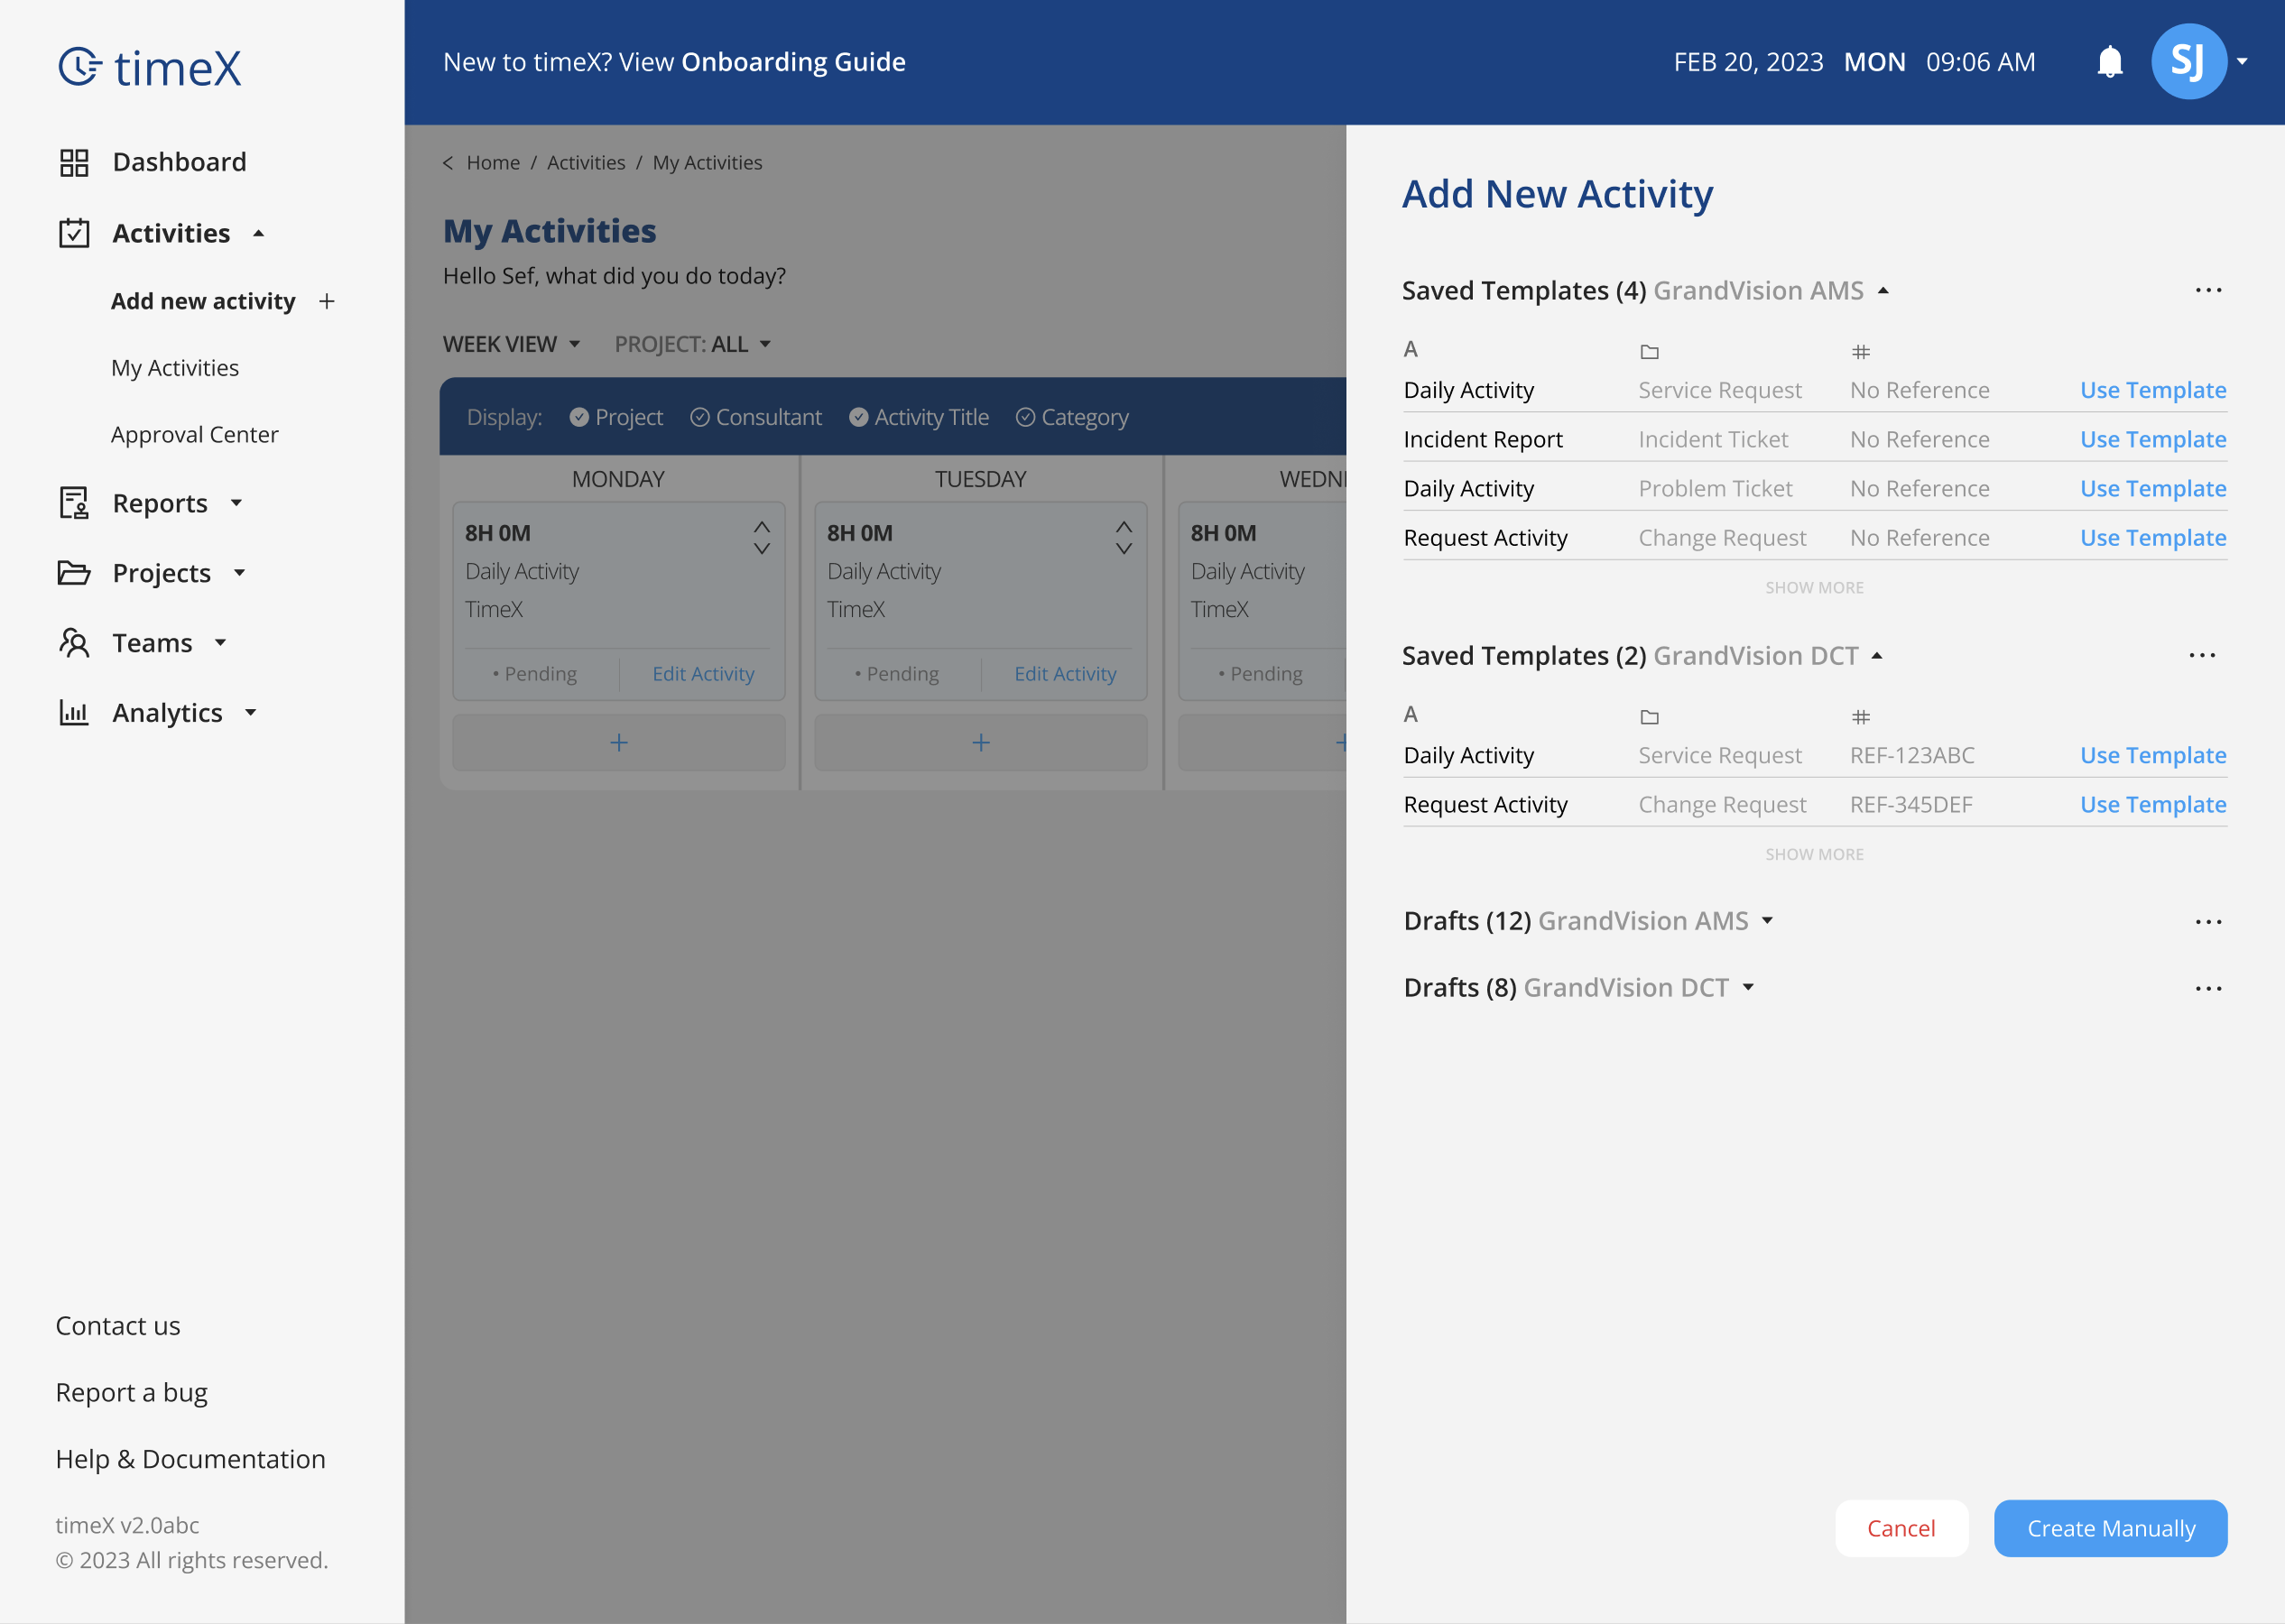
Optimizing even further using templates
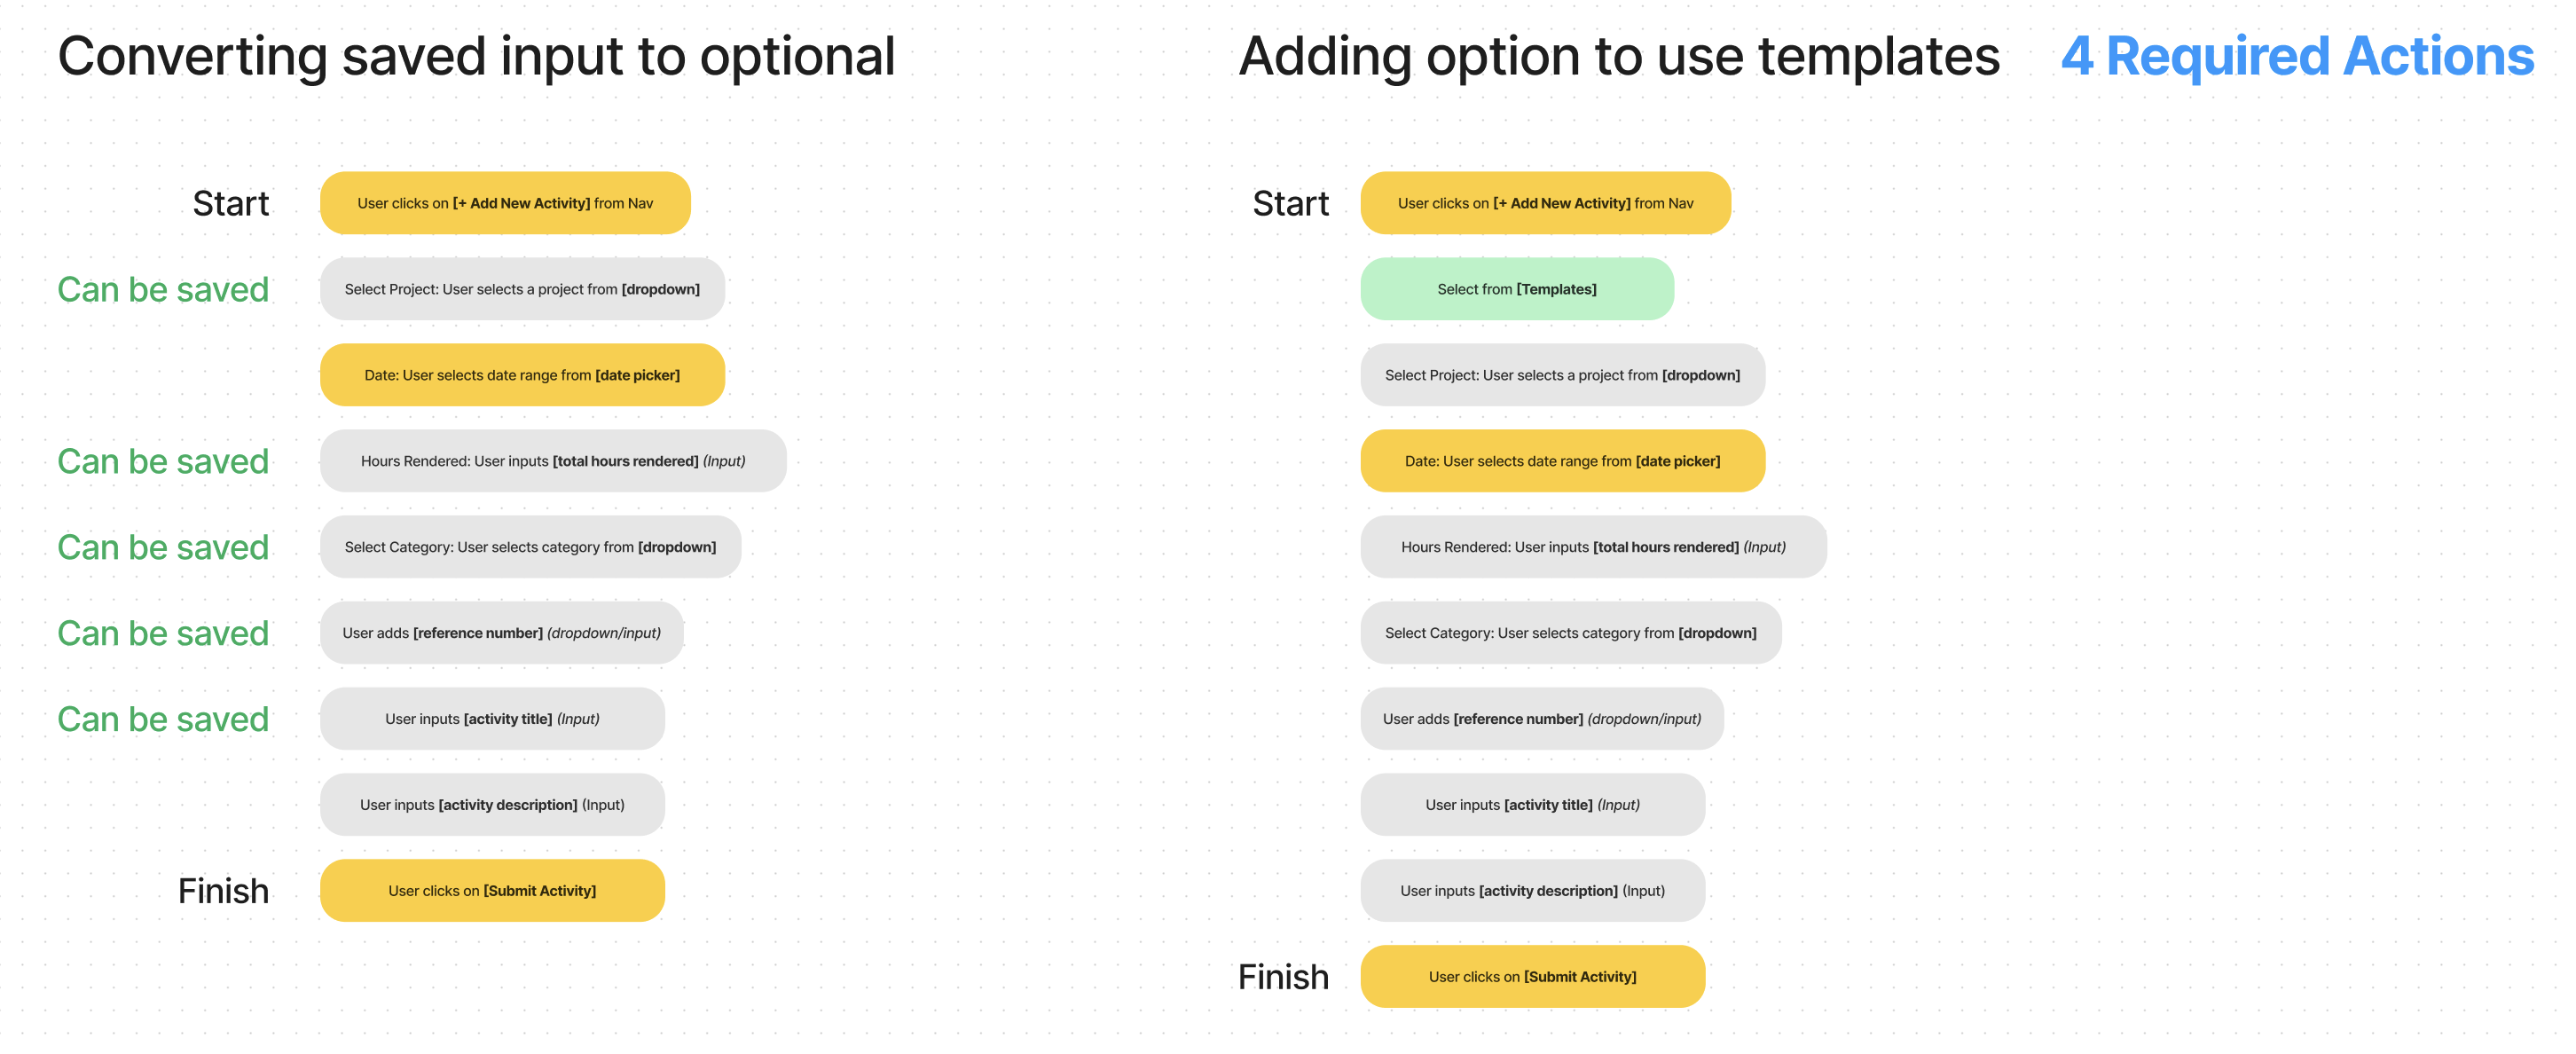
Why opt for templates?
Insights from user interviews indicate that nearly all the activities logged by consultants are essentially the same, albeit sometimes for different projects or varying hours.
Design
Semi Mid-Fidelity Prototypes
See high-fidelity designs at the end (after Impact)


Management
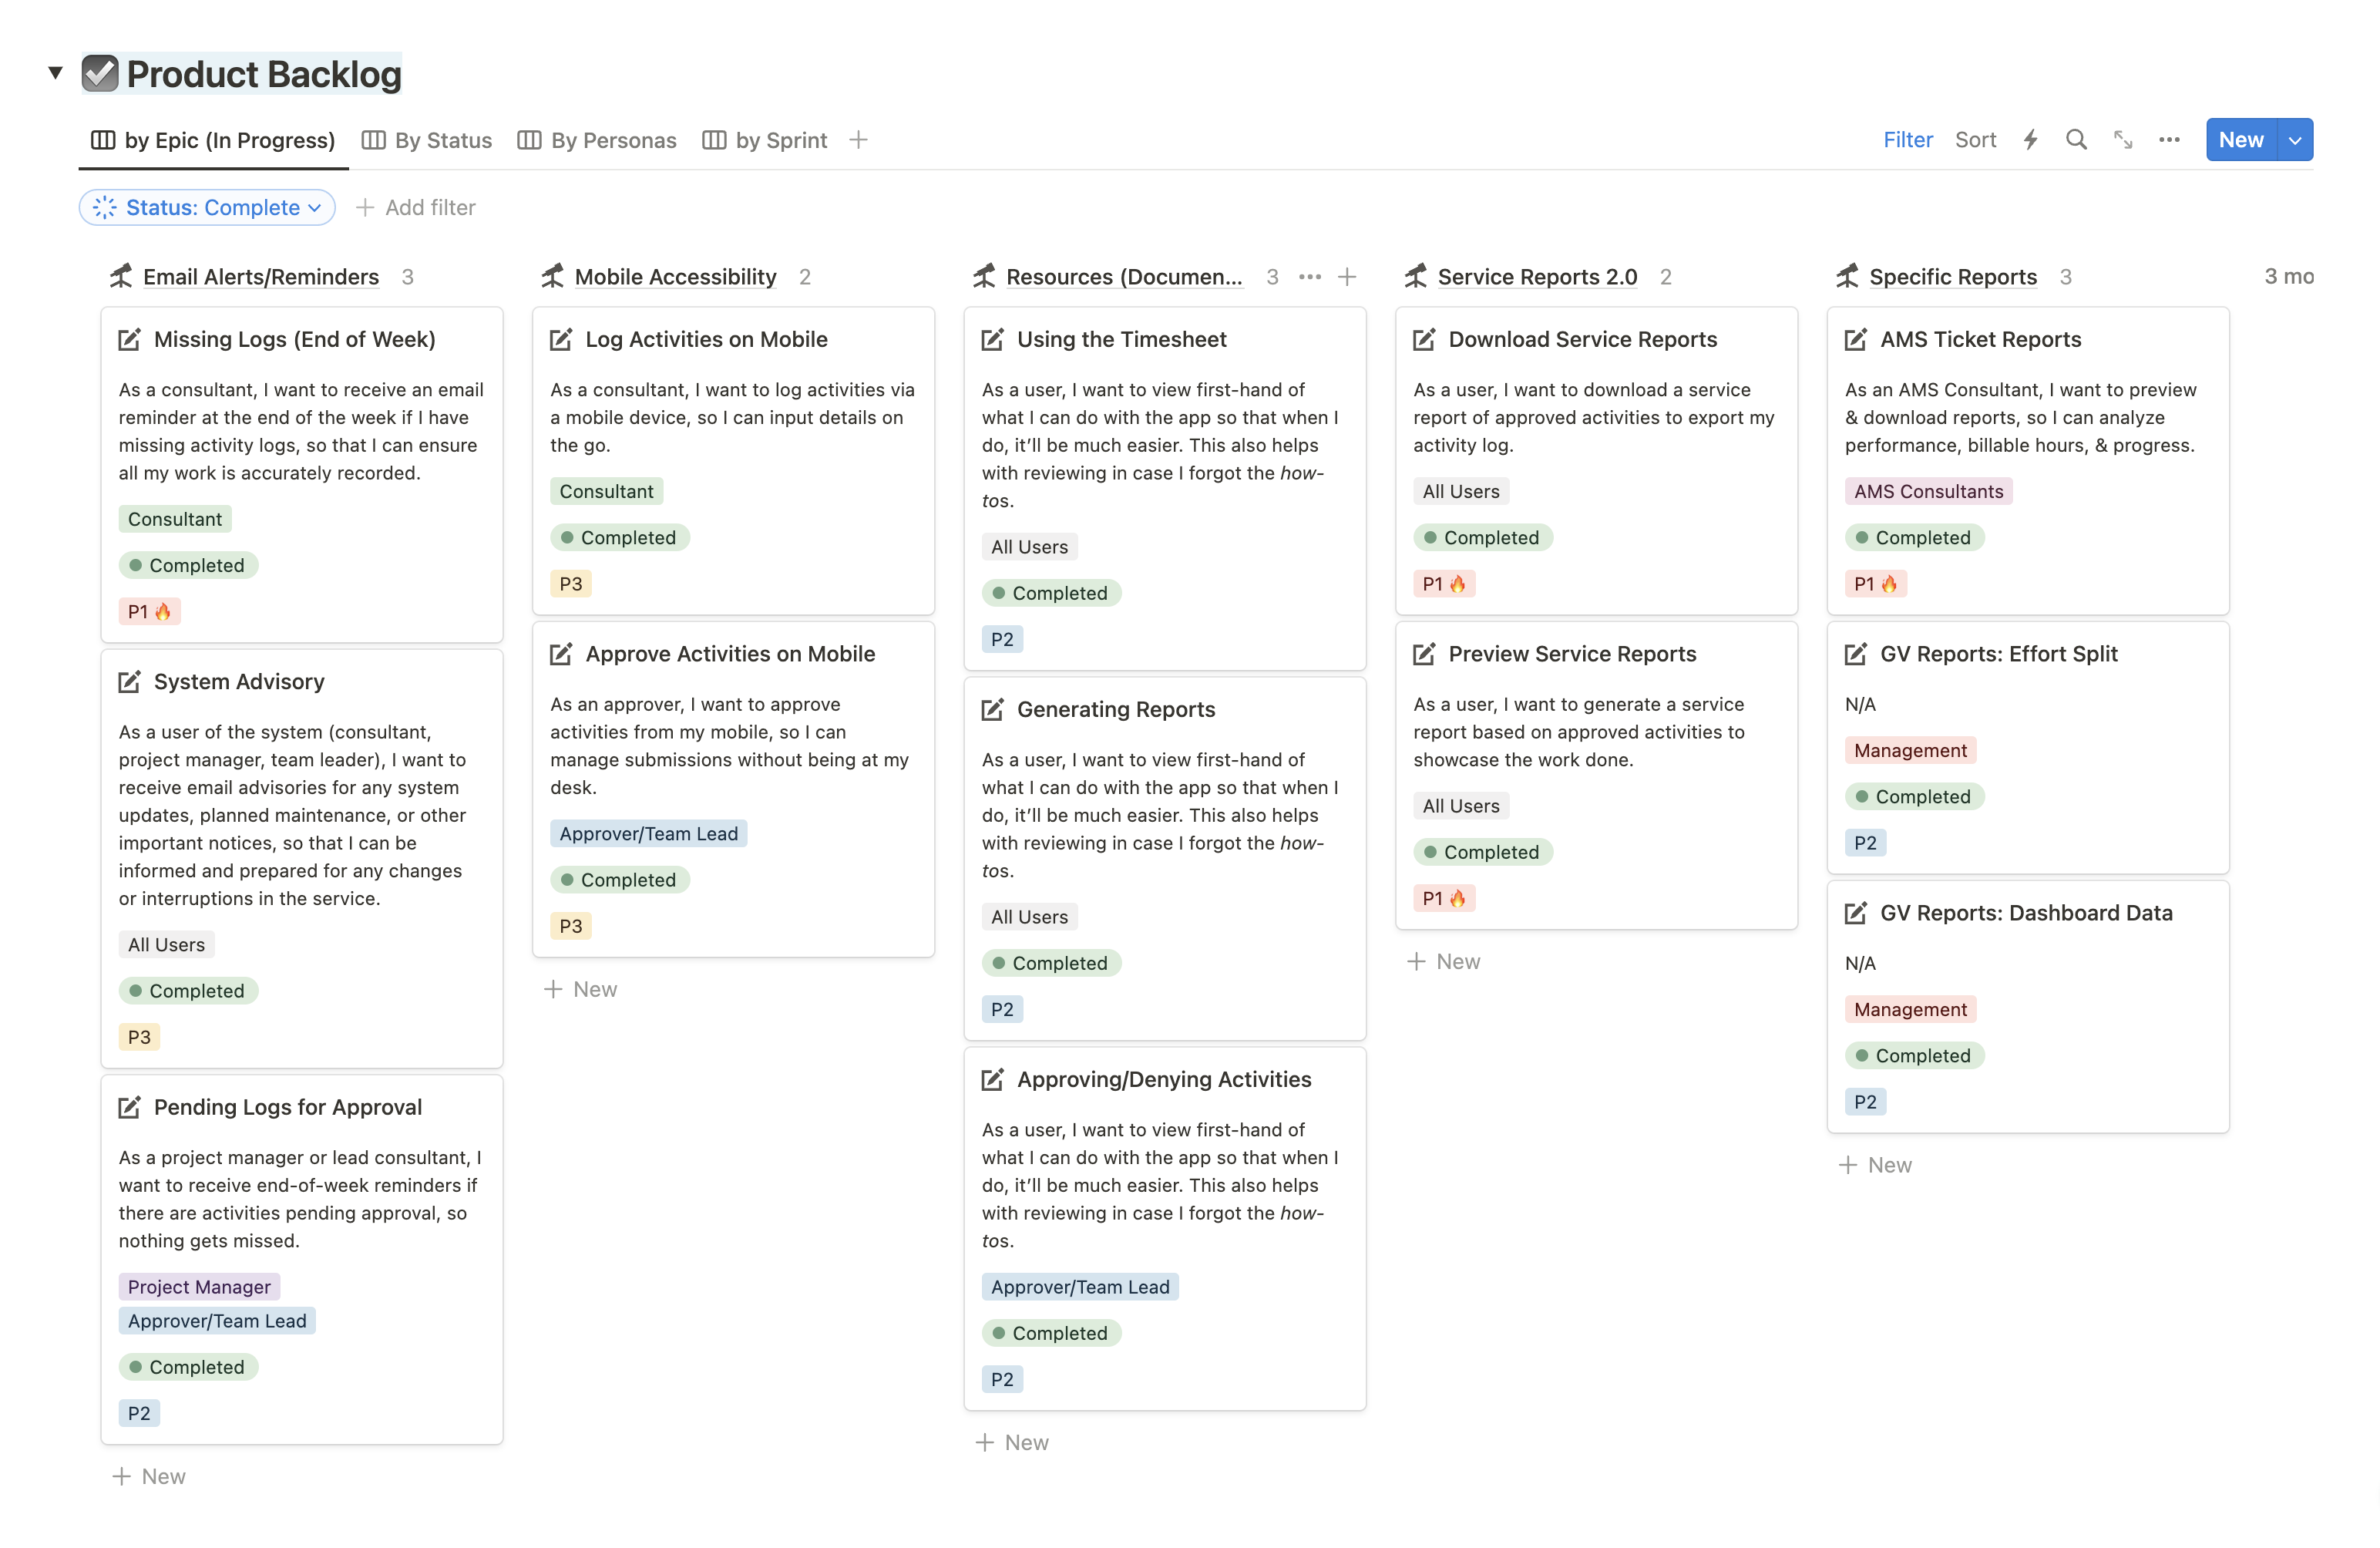
Together with the Scrum master, we crafted and managed the product roadmap & backlog which outlines future enhancements, features, and strategic directions.
Impact
User Impact
Previous ave. time to accomplish task: 75 seconds on 11 steps.
Today? 17 seconds on 6 steps.
Using templates? Quicker. 8 seconds on 4 steps.
Business Impact
The efficient submission of activities and immediate generation of service reports in TimeX v2 has substantial business implications. Beyond the streamlined process, it signifies:
- Improved Cash Flow - With consultants able to promptly submit activities and generate service reports upon approval, the billing cycle shortens. This results in a more consistent and accelerated cash flow for the business.
- Real-Time Revenue Tracking - The ability to generate service reports on demand means that revenue tracking becomes a real-time process. This enhances financial visibility and allows for quicker decision-making based on up-to-date revenue figures.
- Enhanced Billing Accuracy - Real-time service reports contribute to more accurate and transparent billing. This reduces the likelihood of errors or discrepancies in client invoices, fostering trust and credibility.
- Client Satisfaction and Loyalty - Clients benefit from receiving timely and accurate service reports. This improved service can enhance client satisfaction, leading to stronger client relationships and potential repeat business.
- Operational Efficiency - The streamlined process contributes to overall operational efficiency. Teams can focus on proactive tasks rather than spending significant time on periodic service report generation.
- Scalability - As the business grows, the scalable nature of real-time activity submission and service report generation ensures that these processes remain efficient and effective, even with an increasing workload.
Personal Takeaways
Design Discipline
Good design is disciplined and unbiased. Avoiding personal biases is crucial. Designs should be grounded in data; otherwise, they risk becoming counterproductive. When leaning on assumptions, swift validation or correction is imperative for effective decision-making.
Challenge = Learning
Wearing multiple hats as a designer and manager alongside three developers was a rich learning experience. It broadened my grasp of product management, refined decision-making skills, and ignited a fresh passion for design within the product management landscape.
Expanded UX Horizons
UX involves more than research and design; it requires analyzing past work and anticipating future developments. This project deepened my understanding of decoding research intricacies and translating them into a functional design. It underscores the importance of a comprehensive view for navigating the dynamic UX landscape.
These insights encapsulate the project's diverse facets, emphasizing the importance of data-driven design, the synergy of roles in product management, and the broader spectrum of UX responsibilities throughout the project lifecycle.